Belizean vs Swedish 10th Grade
COMPARE
Belizean
Swedish
10th Grade
10th Grade Comparison
Belizeans
Swedes
90.2%
10TH GRADE
0.0/ 100
METRIC RATING
321st/ 347
METRIC RANK
95.9%
10TH GRADE
100.0/ 100
METRIC RATING
4th/ 347
METRIC RANK
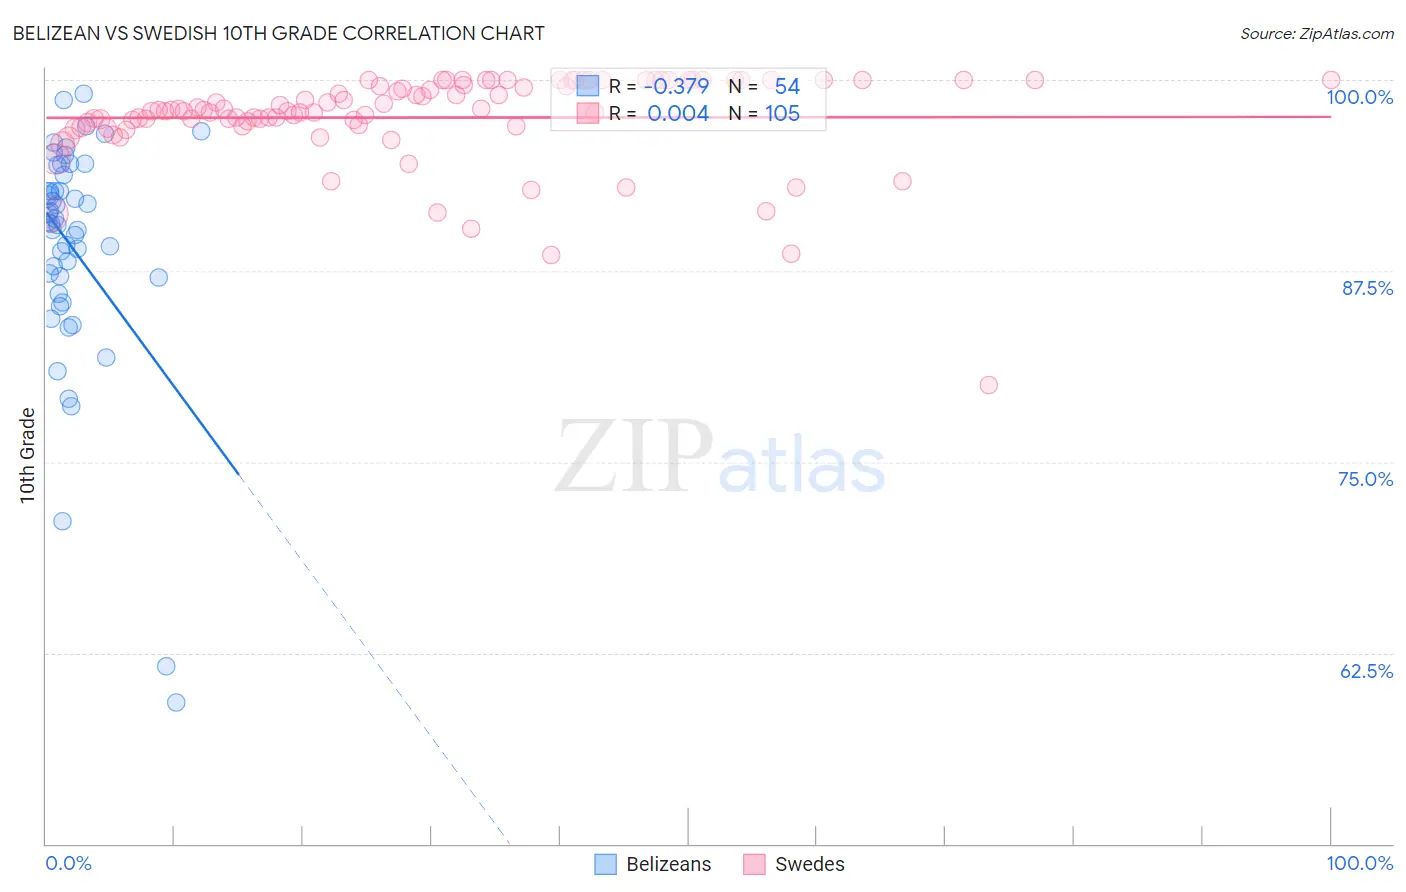
Belizean vs Swedish 10th Grade Correlation Chart
The statistical analysis conducted on geographies consisting of 144,225,006 people shows a mild negative correlation between the proportion of Belizeans and percentage of population with at least 10th grade education in the United States with a correlation coefficient (R) of -0.379 and weighted average of 90.2%. Similarly, the statistical analysis conducted on geographies consisting of 539,231,897 people shows no correlation between the proportion of Swedes and percentage of population with at least 10th grade education in the United States with a correlation coefficient (R) of 0.004 and weighted average of 95.9%, a difference of 6.4%.
10th Grade Correlation Summary
| Measurement | Belizean | Swedish |
| Minimum | 59.3% | 80.0% |
| Maximum | 99.1% | 100.0% |
| Range | 39.8% | 20.0% |
| Mean | 88.9% | 97.5% |
| Median | 90.6% | 98.0% |
| Interquartile 25% (IQ1) | 87.1% | 97.0% |
| Interquartile 75% (IQ3) | 93.8% | 100.0% |
| Interquartile Range (IQR) | 6.7% | 3.0% |
| Standard Deviation (Sample) | 7.8% | 3.1% |
| Standard Deviation (Population) | 7.7% | 3.1% |
Similar Demographics by 10th Grade
Demographics Similar to Belizeans by 10th Grade
In terms of 10th grade, the demographic groups most similar to Belizeans are Houma (90.2%, a difference of 0.0%), Nicaraguan (90.2%, a difference of 0.010%), Tohono O'odham (90.1%, a difference of 0.010%), Immigrants from Cuba (90.2%, a difference of 0.090%), and Immigrants from Belize (90.1%, a difference of 0.10%).
| Demographics | Rating | Rank | 10th Grade |
| Nepalese | 0.0 /100 | #314 | Tragic 90.7% |
| Immigrants | Caribbean | 0.0 /100 | #315 | Tragic 90.6% |
| Ecuadorians | 0.0 /100 | #316 | Tragic 90.6% |
| Immigrants | Ecuador | 0.0 /100 | #317 | Tragic 90.4% |
| Immigrants | Cuba | 0.0 /100 | #318 | Tragic 90.2% |
| Nicaraguans | 0.0 /100 | #319 | Tragic 90.2% |
| Houma | 0.0 /100 | #320 | Tragic 90.2% |
| Belizeans | 0.0 /100 | #321 | Tragic 90.2% |
| Tohono O'odham | 0.0 /100 | #322 | Tragic 90.1% |
| Immigrants | Belize | 0.0 /100 | #323 | Tragic 90.1% |
| Immigrants | Armenia | 0.0 /100 | #324 | Tragic 89.9% |
| Puerto Ricans | 0.0 /100 | #325 | Tragic 89.8% |
| Central American Indians | 0.0 /100 | #326 | Tragic 89.7% |
| Immigrants | Nicaragua | 0.0 /100 | #327 | Tragic 89.5% |
| Immigrants | Cabo Verde | 0.0 /100 | #328 | Tragic 89.5% |
Demographics Similar to Swedes by 10th Grade
In terms of 10th grade, the demographic groups most similar to Swedes are Slovene (95.9%, a difference of 0.0%), Carpatho Rusyn (95.9%, a difference of 0.020%), Slovak (96.0%, a difference of 0.10%), Polish (95.8%, a difference of 0.12%), and German (95.8%, a difference of 0.13%).
| Demographics | Rating | Rank | 10th Grade |
| Norwegians | 100.0 /100 | #1 | Exceptional 96.2% |
| Slovaks | 100.0 /100 | #2 | Exceptional 96.0% |
| Slovenes | 100.0 /100 | #3 | Exceptional 95.9% |
| Swedes | 100.0 /100 | #4 | Exceptional 95.9% |
| Carpatho Rusyns | 100.0 /100 | #5 | Exceptional 95.9% |
| Poles | 100.0 /100 | #6 | Exceptional 95.8% |
| Germans | 100.0 /100 | #7 | Exceptional 95.8% |
| Lithuanians | 100.0 /100 | #8 | Exceptional 95.8% |
| Finns | 100.0 /100 | #9 | Exceptional 95.8% |
| Croatians | 100.0 /100 | #10 | Exceptional 95.7% |
| Danes | 100.0 /100 | #11 | Exceptional 95.7% |
| Tlingit-Haida | 100.0 /100 | #12 | Exceptional 95.7% |
| English | 100.0 /100 | #13 | Exceptional 95.6% |
| Tsimshian | 100.0 /100 | #14 | Exceptional 95.6% |
| Irish | 100.0 /100 | #15 | Exceptional 95.6% |