Belizean vs Scandinavian High School Diploma
COMPARE
Belizean
Scandinavian
High School Diploma
High School Diploma Comparison
Belizeans
Scandinavians
84.3%
HIGH SCHOOL DIPLOMA
0.0/ 100
METRIC RATING
316th/ 347
METRIC RANK
91.5%
HIGH SCHOOL DIPLOMA
99.9/ 100
METRIC RATING
23rd/ 347
METRIC RANK
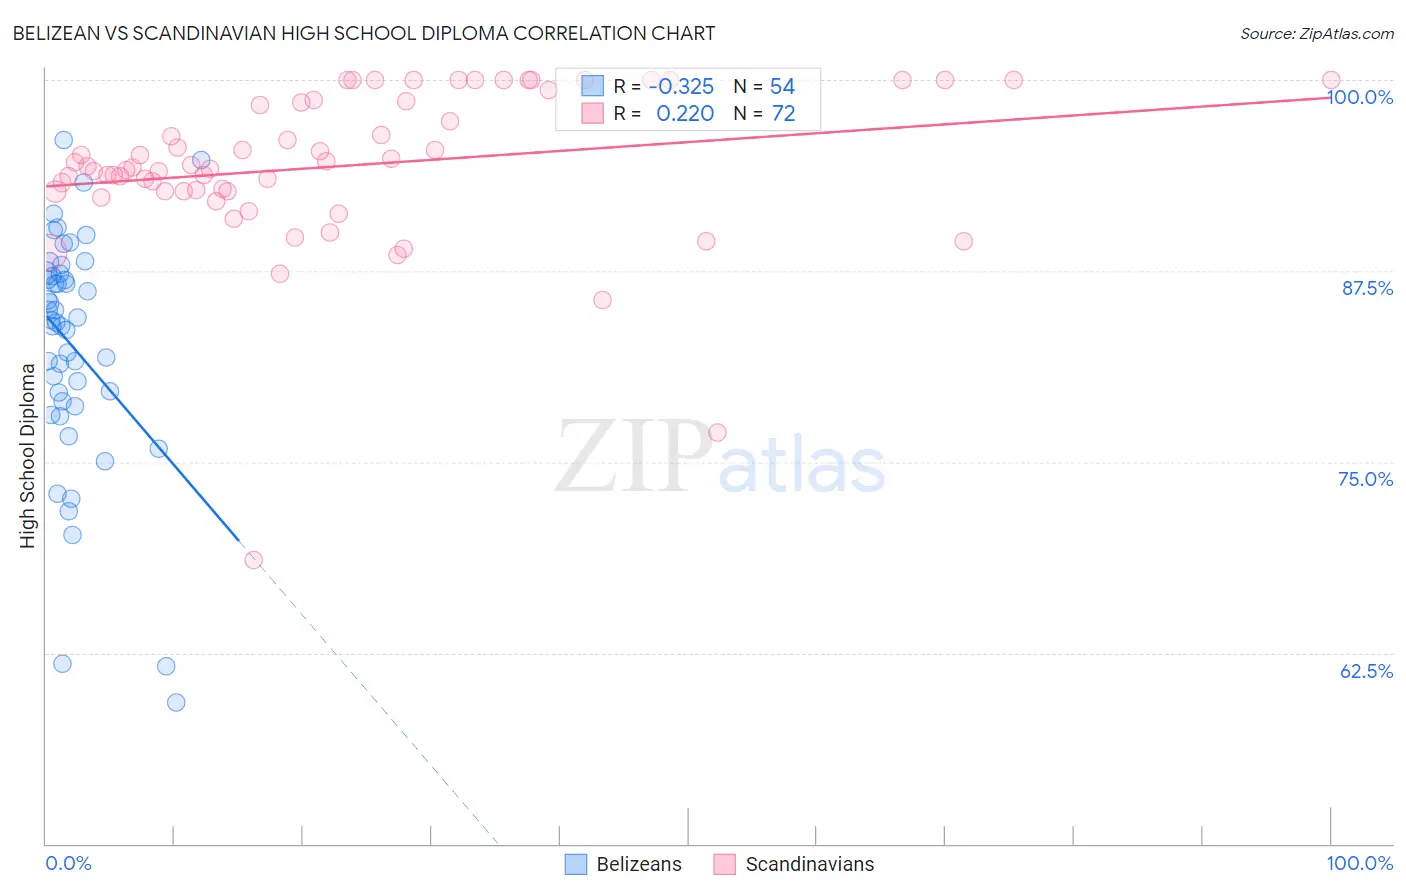
Belizean vs Scandinavian High School Diploma Correlation Chart
The statistical analysis conducted on geographies consisting of 144,225,006 people shows a mild negative correlation between the proportion of Belizeans and percentage of population with at least high school diploma education in the United States with a correlation coefficient (R) of -0.325 and weighted average of 84.3%. Similarly, the statistical analysis conducted on geographies consisting of 472,659,475 people shows a weak positive correlation between the proportion of Scandinavians and percentage of population with at least high school diploma education in the United States with a correlation coefficient (R) of 0.220 and weighted average of 91.5%, a difference of 8.6%.
High School Diploma Correlation Summary
| Measurement | Belizean | Scandinavian |
| Minimum | 59.3% | 68.6% |
| Maximum | 96.1% | 100.0% |
| Range | 36.8% | 31.4% |
| Mean | 82.5% | 94.4% |
| Median | 84.2% | 94.3% |
| Interquartile 25% (IQ1) | 79.0% | 92.7% |
| Interquartile 75% (IQ3) | 87.3% | 98.6% |
| Interquartile Range (IQR) | 8.3% | 5.9% |
| Standard Deviation (Sample) | 7.8% | 5.3% |
| Standard Deviation (Population) | 7.7% | 5.2% |
Similar Demographics by High School Diploma
Demographics Similar to Belizeans by High School Diploma
In terms of high school diploma, the demographic groups most similar to Belizeans are Immigrants from Caribbean (84.3%, a difference of 0.060%), Immigrants from Belize (84.2%, a difference of 0.13%), Central American Indian (84.2%, a difference of 0.16%), Nicaraguan (84.1%, a difference of 0.26%), and Puerto Rican (84.7%, a difference of 0.40%).
| Demographics | Rating | Rank | High School Diploma |
| Immigrants | Dominica | 0.0 /100 | #309 | Tragic 85.2% |
| Apache | 0.0 /100 | #310 | Tragic 85.1% |
| Ecuadorians | 0.0 /100 | #311 | Tragic 85.1% |
| Cape Verdeans | 0.0 /100 | #312 | Tragic 85.1% |
| Immigrants | Ecuador | 0.0 /100 | #313 | Tragic 84.8% |
| Yaqui | 0.0 /100 | #314 | Tragic 84.7% |
| Puerto Ricans | 0.0 /100 | #315 | Tragic 84.7% |
| Belizeans | 0.0 /100 | #316 | Tragic 84.3% |
| Immigrants | Caribbean | 0.0 /100 | #317 | Tragic 84.3% |
| Immigrants | Belize | 0.0 /100 | #318 | Tragic 84.2% |
| Central American Indians | 0.0 /100 | #319 | Tragic 84.2% |
| Nicaraguans | 0.0 /100 | #320 | Tragic 84.1% |
| Yuman | 0.0 /100 | #321 | Tragic 84.0% |
| Lumbee | 0.0 /100 | #322 | Tragic 83.6% |
| Immigrants | Cuba | 0.0 /100 | #323 | Tragic 83.5% |
Demographics Similar to Scandinavians by High School Diploma
In terms of high school diploma, the demographic groups most similar to Scandinavians are Italian (91.5%, a difference of 0.0%), Thai (91.5%, a difference of 0.0%), Estonian (91.6%, a difference of 0.030%), Filipino (91.6%, a difference of 0.040%), and Czech (91.6%, a difference of 0.050%).
| Demographics | Rating | Rank | High School Diploma |
| Finns | 100.0 /100 | #16 | Exceptional 91.7% |
| Immigrants | Singapore | 99.9 /100 | #17 | Exceptional 91.7% |
| Germans | 99.9 /100 | #18 | Exceptional 91.7% |
| Maltese | 99.9 /100 | #19 | Exceptional 91.6% |
| Czechs | 99.9 /100 | #20 | Exceptional 91.6% |
| Filipinos | 99.9 /100 | #21 | Exceptional 91.6% |
| Estonians | 99.9 /100 | #22 | Exceptional 91.6% |
| Scandinavians | 99.9 /100 | #23 | Exceptional 91.5% |
| Italians | 99.9 /100 | #24 | Exceptional 91.5% |
| Thais | 99.9 /100 | #25 | Exceptional 91.5% |
| Russians | 99.9 /100 | #26 | Exceptional 91.5% |
| Cypriots | 99.9 /100 | #27 | Exceptional 91.5% |
| Tlingit-Haida | 99.9 /100 | #28 | Exceptional 91.4% |
| Europeans | 99.9 /100 | #29 | Exceptional 91.4% |
| Iranians | 99.9 /100 | #30 | Exceptional 91.4% |