Belizean vs Immigrants from Laos 6th Grade
COMPARE
Belizean
Immigrants from Laos
6th Grade
6th Grade Comparison
Belizeans
Immigrants from Laos
95.3%
6TH GRADE
0.0/ 100
METRIC RATING
318th/ 347
METRIC RANK
95.7%
6TH GRADE
0.0/ 100
METRIC RATING
299th/ 347
METRIC RANK
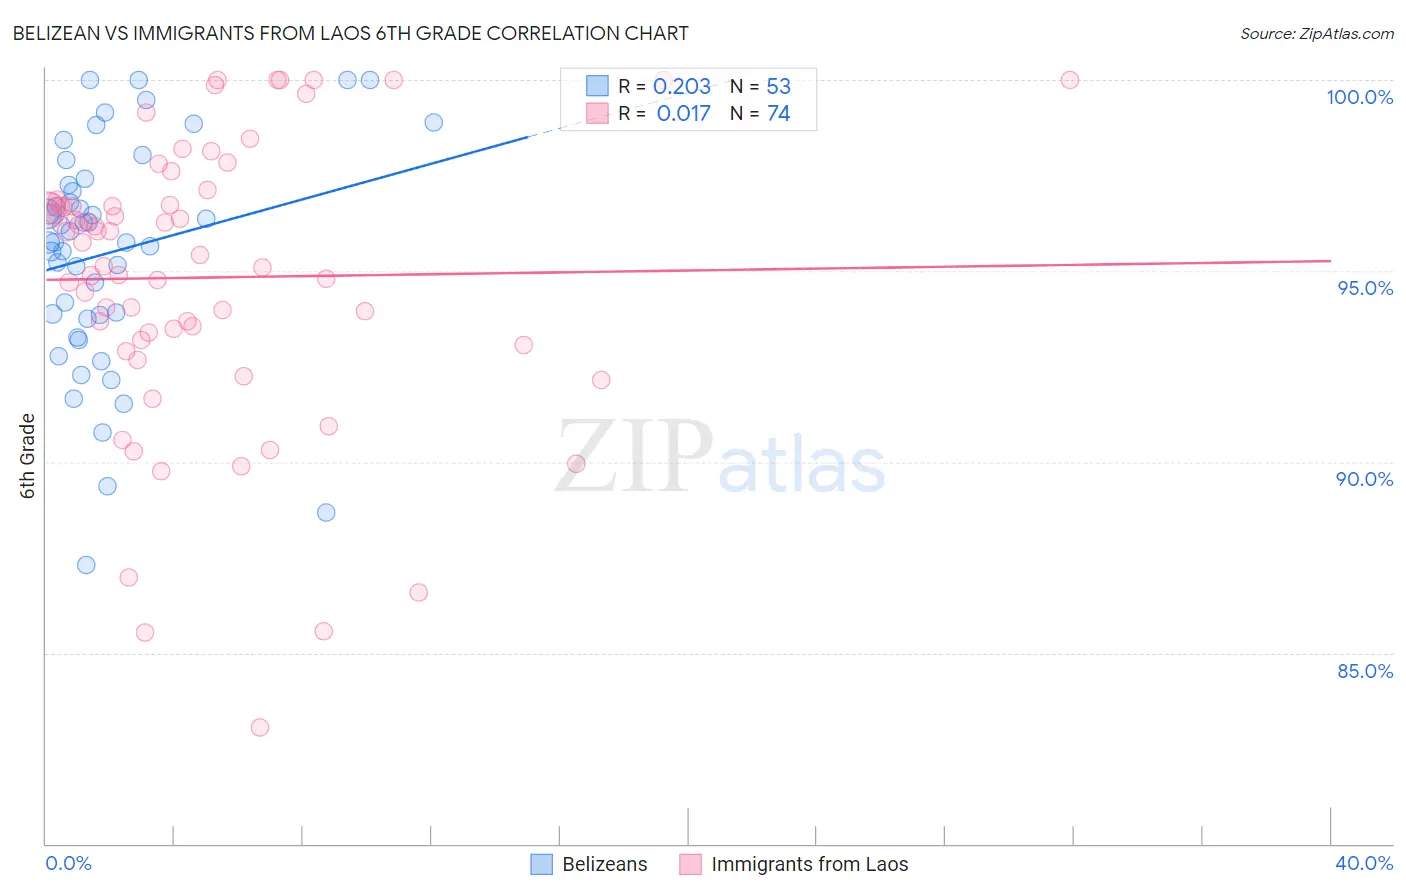
Belizean vs Immigrants from Laos 6th Grade Correlation Chart
The statistical analysis conducted on geographies consisting of 144,224,236 people shows a weak positive correlation between the proportion of Belizeans and percentage of population with at least 6th grade education in the United States with a correlation coefficient (R) of 0.203 and weighted average of 95.3%. Similarly, the statistical analysis conducted on geographies consisting of 201,472,886 people shows no correlation between the proportion of Immigrants from Laos and percentage of population with at least 6th grade education in the United States with a correlation coefficient (R) of 0.017 and weighted average of 95.7%, a difference of 0.46%.
6th Grade Correlation Summary
| Measurement | Belizean | Immigrants from Laos |
| Minimum | 87.3% | 83.0% |
| Maximum | 100.0% | 100.0% |
| Range | 12.7% | 17.0% |
| Mean | 95.5% | 94.8% |
| Median | 95.8% | 95.6% |
| Interquartile 25% (IQ1) | 93.8% | 93.2% |
| Interquartile 75% (IQ3) | 97.3% | 96.8% |
| Interquartile Range (IQR) | 3.5% | 3.6% |
| Standard Deviation (Sample) | 2.9% | 3.7% |
| Standard Deviation (Population) | 2.9% | 3.7% |
Demographics Similar to Belizeans and Immigrants from Laos by 6th Grade
In terms of 6th grade, the demographic groups most similar to Belizeans are Vietnamese (95.3%, a difference of 0.020%), Japanese (95.4%, a difference of 0.060%), Immigrants from Vietnam (95.4%, a difference of 0.070%), Immigrants from Bangladesh (95.4%, a difference of 0.070%), and Nicaraguan (95.4%, a difference of 0.080%). Similarly, the demographic groups most similar to Immigrants from Laos are Immigrants from Dominica (95.7%, a difference of 0.010%), Sri Lankan (95.8%, a difference of 0.020%), Immigrants (95.7%, a difference of 0.020%), Immigrants from Burma/Myanmar (95.7%, a difference of 0.030%), and Bangladeshi (95.7%, a difference of 0.10%).
| Demographics | Rating | Rank | 6th Grade |
| Sri Lankans | 0.0 /100 | #298 | Tragic 95.8% |
| Immigrants | Laos | 0.0 /100 | #299 | Tragic 95.7% |
| Immigrants | Dominica | 0.0 /100 | #300 | Tragic 95.7% |
| Immigrants | Immigrants | 0.0 /100 | #301 | Tragic 95.7% |
| Immigrants | Burma/Myanmar | 0.0 /100 | #302 | Tragic 95.7% |
| Bangladeshis | 0.0 /100 | #303 | Tragic 95.7% |
| Indonesians | 0.0 /100 | #304 | Tragic 95.6% |
| Immigrants | Cuba | 0.0 /100 | #305 | Tragic 95.6% |
| Immigrants | Haiti | 0.0 /100 | #306 | Tragic 95.6% |
| Guyanese | 0.0 /100 | #307 | Tragic 95.6% |
| Immigrants | Caribbean | 0.0 /100 | #308 | Tragic 95.6% |
| Puerto Ricans | 0.0 /100 | #309 | Tragic 95.5% |
| Ecuadorians | 0.0 /100 | #310 | Tragic 95.5% |
| Immigrants | Portugal | 0.0 /100 | #311 | Tragic 95.5% |
| Immigrants | Guyana | 0.0 /100 | #312 | Tragic 95.5% |
| Nicaraguans | 0.0 /100 | #313 | Tragic 95.4% |
| Immigrants | Vietnam | 0.0 /100 | #314 | Tragic 95.4% |
| Immigrants | Bangladesh | 0.0 /100 | #315 | Tragic 95.4% |
| Japanese | 0.0 /100 | #316 | Tragic 95.4% |
| Vietnamese | 0.0 /100 | #317 | Tragic 95.3% |
| Belizeans | 0.0 /100 | #318 | Tragic 95.3% |