Bangladeshi vs Immigrants from St. Vincent and the Grenadines 7th Grade
COMPARE
Bangladeshi
Immigrants from St. Vincent and the Grenadines
7th Grade
7th Grade Comparison
Bangladeshis
Immigrants from St. Vincent and the Grenadines
94.5%
7TH GRADE
0.0/ 100
METRIC RATING
299th/ 347
METRIC RANK
95.0%
7TH GRADE
0.1/ 100
METRIC RATING
280th/ 347
METRIC RANK
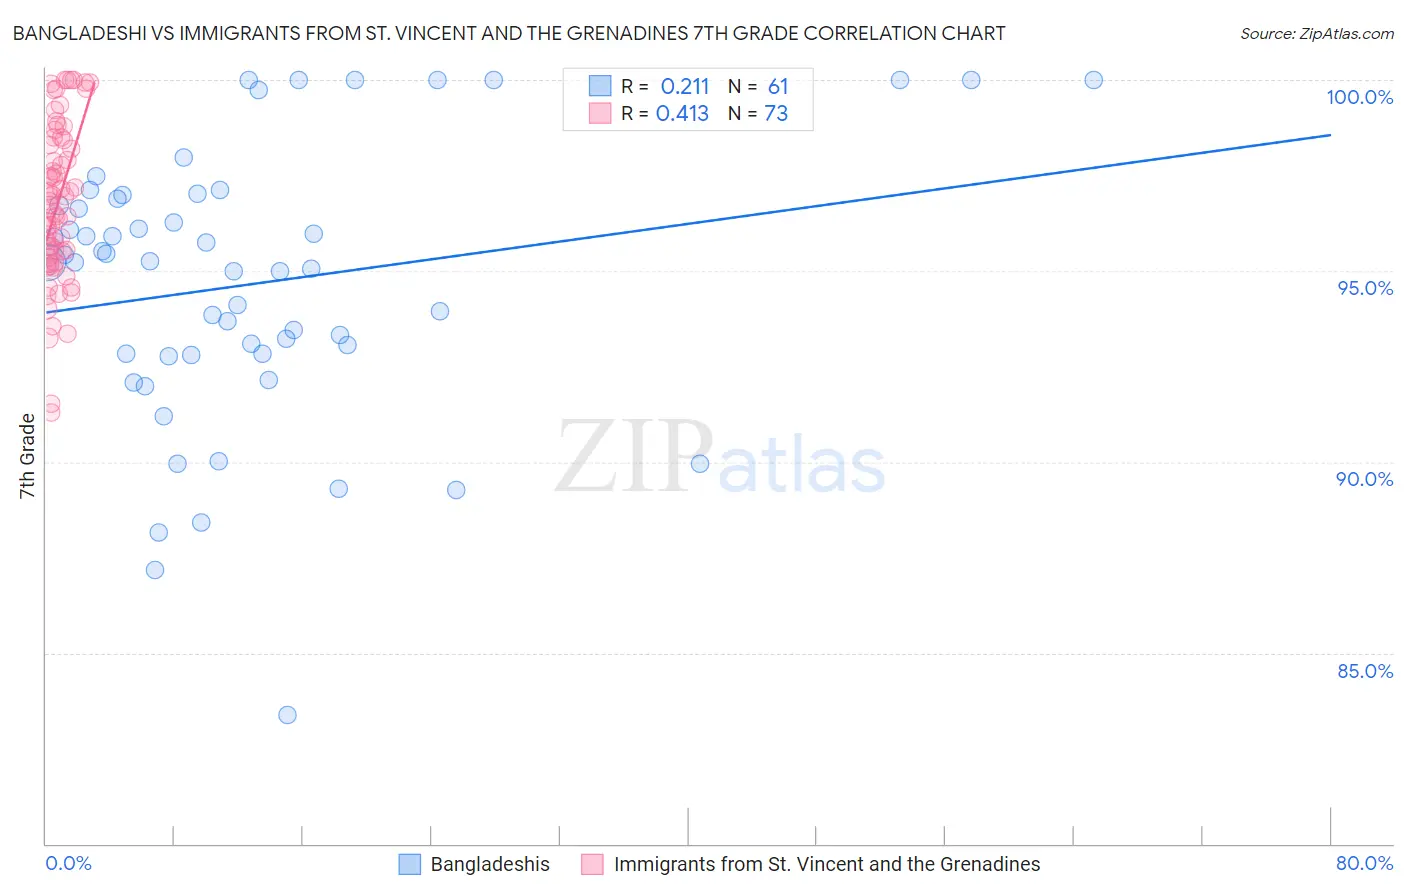
Bangladeshi vs Immigrants from St. Vincent and the Grenadines 7th Grade Correlation Chart
The statistical analysis conducted on geographies consisting of 141,430,495 people shows a weak positive correlation between the proportion of Bangladeshis and percentage of population with at least 7th grade education in the United States with a correlation coefficient (R) of 0.211 and weighted average of 94.5%. Similarly, the statistical analysis conducted on geographies consisting of 56,191,418 people shows a moderate positive correlation between the proportion of Immigrants from St. Vincent and the Grenadines and percentage of population with at least 7th grade education in the United States with a correlation coefficient (R) of 0.413 and weighted average of 95.0%, a difference of 0.53%.
7th Grade Correlation Summary
| Measurement | Bangladeshi | Immigrants from St. Vincent and the Grenadines |
| Minimum | 83.4% | 91.3% |
| Maximum | 100.0% | 100.0% |
| Range | 16.6% | 8.7% |
| Mean | 94.7% | 96.8% |
| Median | 95.2% | 96.8% |
| Interquartile 25% (IQ1) | 92.8% | 95.3% |
| Interquartile 75% (IQ3) | 96.9% | 98.5% |
| Interquartile Range (IQR) | 4.1% | 3.2% |
| Standard Deviation (Sample) | 3.6% | 2.1% |
| Standard Deviation (Population) | 3.6% | 2.1% |
Demographics Similar to Bangladeshis and Immigrants from St. Vincent and the Grenadines by 7th Grade
In terms of 7th grade, the demographic groups most similar to Bangladeshis are Immigrants from South Eastern Asia (94.5%, a difference of 0.010%), Indonesian (94.5%, a difference of 0.010%), Cuban (94.6%, a difference of 0.11%), Yaqui (94.6%, a difference of 0.12%), and Haitian (94.7%, a difference of 0.15%). Similarly, the demographic groups most similar to Immigrants from St. Vincent and the Grenadines are Tohono O'odham (95.0%, a difference of 0.0%), Immigrants from Bolivia (95.0%, a difference of 0.010%), Barbadian (95.1%, a difference of 0.030%), Immigrants from Barbados (95.0%, a difference of 0.070%), and Armenian (95.0%, a difference of 0.070%).
| Demographics | Rating | Rank | 7th Grade |
| Barbadians | 0.1 /100 | #279 | Tragic 95.1% |
| Immigrants | St. Vincent and the Grenadines | 0.1 /100 | #280 | Tragic 95.0% |
| Tohono O'odham | 0.1 /100 | #281 | Tragic 95.0% |
| Immigrants | Bolivia | 0.1 /100 | #282 | Tragic 95.0% |
| Immigrants | Barbados | 0.1 /100 | #283 | Tragic 95.0% |
| Armenians | 0.1 /100 | #284 | Tragic 95.0% |
| Immigrants | Eritrea | 0.1 /100 | #285 | Tragic 94.9% |
| Immigrants | Philippines | 0.0 /100 | #286 | Tragic 94.9% |
| Immigrants | Peru | 0.0 /100 | #287 | Tragic 94.9% |
| British West Indians | 0.0 /100 | #288 | Tragic 94.8% |
| Taiwanese | 0.0 /100 | #289 | Tragic 94.8% |
| Malaysians | 0.0 /100 | #290 | Tragic 94.8% |
| Immigrants | Grenada | 0.0 /100 | #291 | Tragic 94.8% |
| Immigrants | West Indies | 0.0 /100 | #292 | Tragic 94.8% |
| Fijians | 0.0 /100 | #293 | Tragic 94.7% |
| Haitians | 0.0 /100 | #294 | Tragic 94.7% |
| Yaqui | 0.0 /100 | #295 | Tragic 94.6% |
| Cubans | 0.0 /100 | #296 | Tragic 94.6% |
| Immigrants | South Eastern Asia | 0.0 /100 | #297 | Tragic 94.5% |
| Indonesians | 0.0 /100 | #298 | Tragic 94.5% |
| Bangladeshis | 0.0 /100 | #299 | Tragic 94.5% |