Bahamian vs Immigrants from Russia No Schooling Completed
COMPARE
Bahamian
Immigrants from Russia
No Schooling Completed
No Schooling Completed Comparison
Bahamians
Immigrants from Russia
2.2%
NO SCHOOLING COMPLETED
11.6/ 100
METRIC RATING
206th/ 347
METRIC RANK
2.0%
NO SCHOOLING COMPLETED
67.6/ 100
METRIC RATING
155th/ 347
METRIC RANK
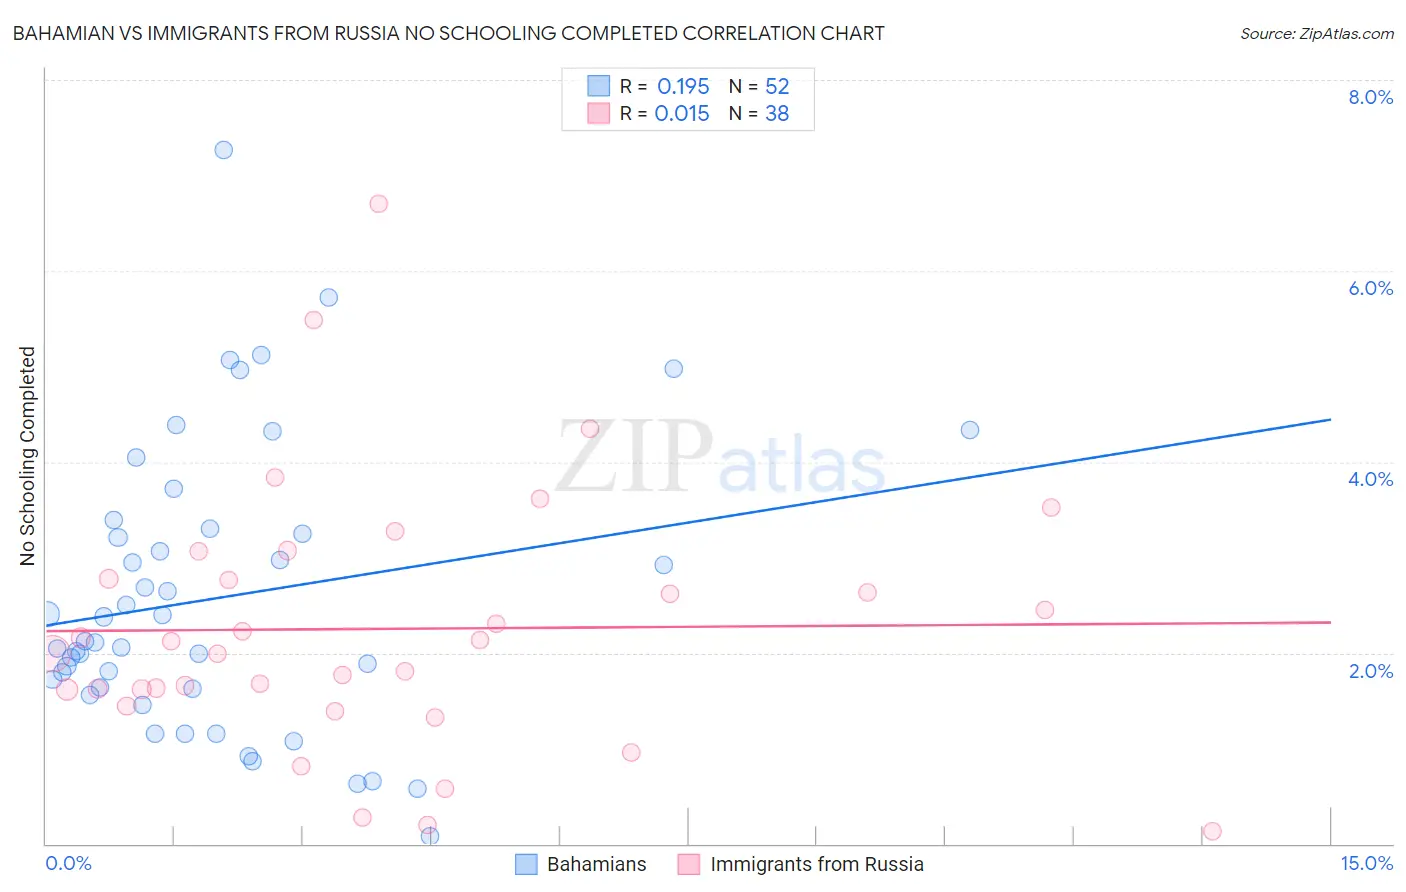
Bahamian vs Immigrants from Russia No Schooling Completed Correlation Chart
The statistical analysis conducted on geographies consisting of 112,360,421 people shows a poor positive correlation between the proportion of Bahamians and percentage of population with no schooling in the United States with a correlation coefficient (R) of 0.195 and weighted average of 2.2%. Similarly, the statistical analysis conducted on geographies consisting of 344,183,318 people shows no correlation between the proportion of Immigrants from Russia and percentage of population with no schooling in the United States with a correlation coefficient (R) of 0.015 and weighted average of 2.0%, a difference of 9.6%.
No Schooling Completed Correlation Summary
| Measurement | Bahamian | Immigrants from Russia |
| Minimum | 0.079% | 0.13% |
| Maximum | 7.3% | 6.7% |
| Range | 7.2% | 6.6% |
| Mean | 2.6% | 2.3% |
| Median | 2.1% | 2.1% |
| Interquartile 25% (IQ1) | 1.6% | 1.6% |
| Interquartile 75% (IQ3) | 3.3% | 2.8% |
| Interquartile Range (IQR) | 1.6% | 1.2% |
| Standard Deviation (Sample) | 1.5% | 1.4% |
| Standard Deviation (Population) | 1.5% | 1.3% |
Similar Demographics by No Schooling Completed
Demographics Similar to Bahamians by No Schooling Completed
In terms of no schooling completed, the demographic groups most similar to Bahamians are Immigrants from Bahamas (2.2%, a difference of 0.010%), South American Indian (2.2%, a difference of 0.18%), Uruguayan (2.2%, a difference of 0.19%), Hopi (2.2%, a difference of 0.41%), and Immigrants from Oceania (2.2%, a difference of 0.44%).
| Demographics | Rating | Rank | No Schooling Completed |
| Africans | 21.8 /100 | #199 | Fair 2.2% |
| Immigrants | Northern Africa | 19.5 /100 | #200 | Poor 2.2% |
| Costa Ricans | 17.1 /100 | #201 | Poor 2.2% |
| Moroccans | 13.7 /100 | #202 | Poor 2.2% |
| Laotians | 13.3 /100 | #203 | Poor 2.2% |
| Hopi | 12.9 /100 | #204 | Poor 2.2% |
| Immigrants | Bahamas | 11.6 /100 | #205 | Poor 2.2% |
| Bahamians | 11.6 /100 | #206 | Poor 2.2% |
| South American Indians | 11.0 /100 | #207 | Poor 2.2% |
| Uruguayans | 11.0 /100 | #208 | Poor 2.2% |
| Immigrants | Oceania | 10.2 /100 | #209 | Poor 2.2% |
| Natives/Alaskans | 10.0 /100 | #210 | Tragic 2.2% |
| Immigrants | Panama | 8.8 /100 | #211 | Tragic 2.3% |
| Immigrants | Morocco | 8.7 /100 | #212 | Tragic 2.3% |
| Ute | 8.2 /100 | #213 | Tragic 2.3% |
Demographics Similar to Immigrants from Russia by No Schooling Completed
In terms of no schooling completed, the demographic groups most similar to Immigrants from Russia are Chilean (2.0%, a difference of 0.070%), Immigrants from Sri Lanka (2.0%, a difference of 0.10%), Immigrants from Venezuela (2.0%, a difference of 0.14%), Immigrants from Korea (2.0%, a difference of 0.14%), and Immigrants from Spain (2.0%, a difference of 0.19%).
| Demographics | Rating | Rank | No Schooling Completed |
| Shoshone | 76.7 /100 | #148 | Good 2.0% |
| Immigrants | North Macedonia | 75.9 /100 | #149 | Good 2.0% |
| Blackfeet | 72.9 /100 | #150 | Good 2.0% |
| Immigrants | Jordan | 70.9 /100 | #151 | Good 2.0% |
| Immigrants | Eastern Europe | 70.4 /100 | #152 | Good 2.0% |
| Immigrants | Italy | 68.9 /100 | #153 | Good 2.0% |
| Immigrants | Venezuela | 68.5 /100 | #154 | Good 2.0% |
| Immigrants | Russia | 67.6 /100 | #155 | Good 2.0% |
| Chileans | 67.2 /100 | #156 | Good 2.0% |
| Immigrants | Sri Lanka | 67.0 /100 | #157 | Good 2.0% |
| Immigrants | Korea | 66.7 /100 | #158 | Good 2.0% |
| Immigrants | Spain | 66.4 /100 | #159 | Good 2.0% |
| Kenyans | 65.7 /100 | #160 | Good 2.0% |
| Ugandans | 64.6 /100 | #161 | Good 2.0% |
| Immigrants | Brazil | 63.8 /100 | #162 | Good 2.1% |