Bahamian vs Argentinean Professional Degree
COMPARE
Bahamian
Argentinean
Professional Degree
Professional Degree Comparison
Bahamians
Argentineans
3.7%
PROFESSIONAL DEGREE
1.1/ 100
METRIC RATING
257th/ 347
METRIC RANK
5.9%
PROFESSIONAL DEGREE
100.0/ 100
METRIC RATING
44th/ 347
METRIC RANK
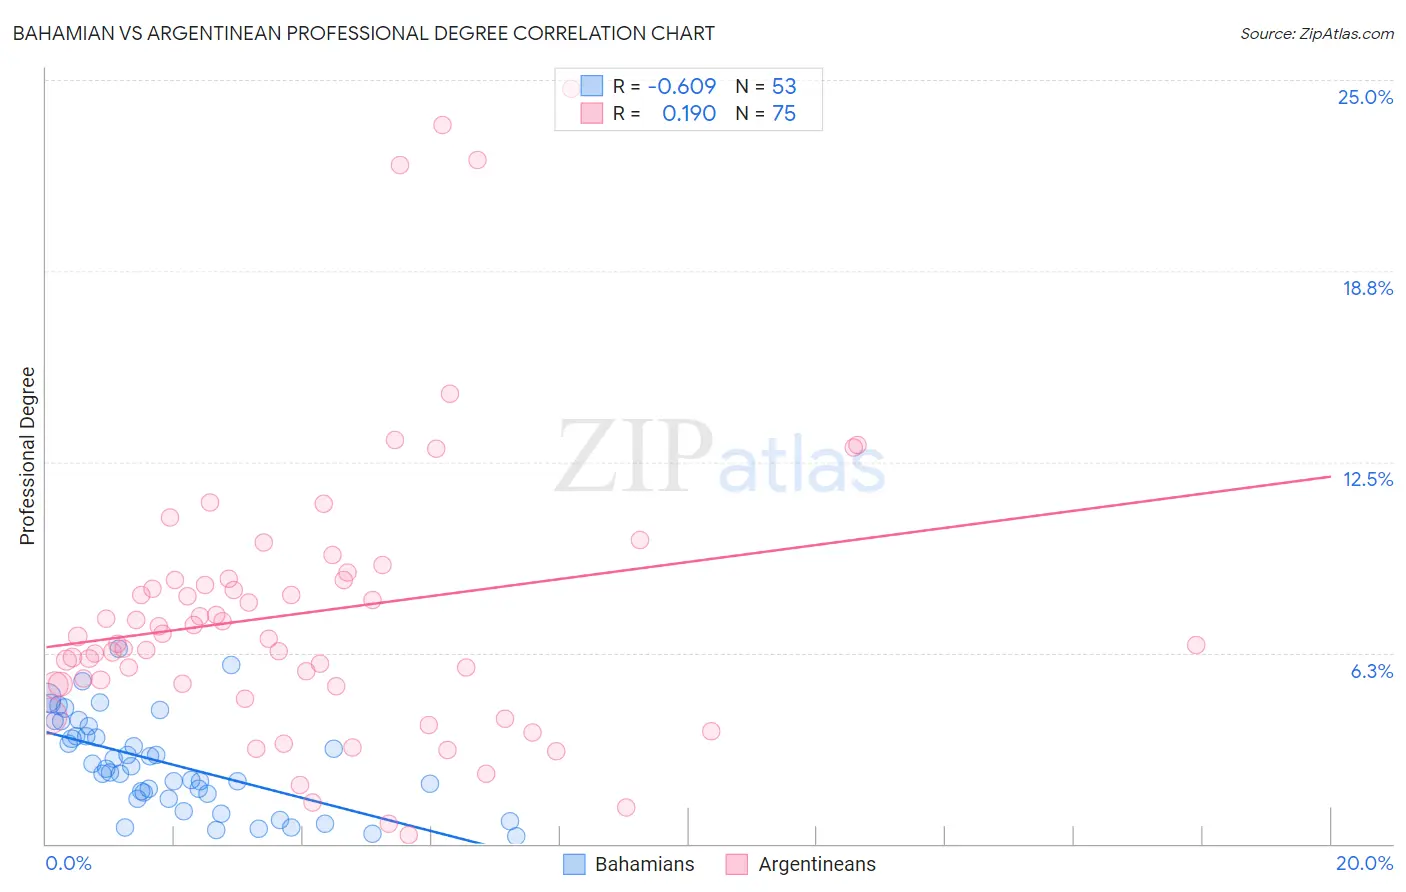
Bahamian vs Argentinean Professional Degree Correlation Chart
The statistical analysis conducted on geographies consisting of 112,564,852 people shows a significant negative correlation between the proportion of Bahamians and percentage of population with at least professional degree education in the United States with a correlation coefficient (R) of -0.609 and weighted average of 3.7%. Similarly, the statistical analysis conducted on geographies consisting of 296,877,739 people shows a poor positive correlation between the proportion of Argentineans and percentage of population with at least professional degree education in the United States with a correlation coefficient (R) of 0.190 and weighted average of 5.9%, a difference of 60.9%.
Professional Degree Correlation Summary
| Measurement | Bahamian | Argentinean |
| Minimum | 0.24% | 0.30% |
| Maximum | 6.4% | 24.7% |
| Range | 6.2% | 24.4% |
| Mean | 2.6% | 7.6% |
| Median | 2.5% | 6.7% |
| Interquartile 25% (IQ1) | 1.6% | 5.2% |
| Interquartile 75% (IQ3) | 3.7% | 8.7% |
| Interquartile Range (IQR) | 2.1% | 3.5% |
| Standard Deviation (Sample) | 1.5% | 4.8% |
| Standard Deviation (Population) | 1.5% | 4.8% |
Similar Demographics by Professional Degree
Demographics Similar to Bahamians by Professional Degree
In terms of professional degree, the demographic groups most similar to Bahamians are Immigrants from St. Vincent and the Grenadines (3.7%, a difference of 0.080%), African (3.7%, a difference of 0.30%), Indonesian (3.7%, a difference of 0.31%), Iroquois (3.7%, a difference of 0.37%), and Osage (3.7%, a difference of 0.47%).
| Demographics | Rating | Rank | Professional Degree |
| Immigrants | Fiji | 1.5 /100 | #250 | Tragic 3.7% |
| Immigrants | Nicaragua | 1.4 /100 | #251 | Tragic 3.7% |
| Jamaicans | 1.4 /100 | #252 | Tragic 3.7% |
| Pueblo | 1.4 /100 | #253 | Tragic 3.7% |
| Tongans | 1.3 /100 | #254 | Tragic 3.7% |
| Osage | 1.2 /100 | #255 | Tragic 3.7% |
| Iroquois | 1.2 /100 | #256 | Tragic 3.7% |
| Bahamians | 1.1 /100 | #257 | Tragic 3.7% |
| Immigrants | St. Vincent and the Grenadines | 1.1 /100 | #258 | Tragic 3.7% |
| Africans | 1.0 /100 | #259 | Tragic 3.7% |
| Indonesians | 1.0 /100 | #260 | Tragic 3.7% |
| Immigrants | Guyana | 1.0 /100 | #261 | Tragic 3.7% |
| U.S. Virgin Islanders | 1.0 /100 | #262 | Tragic 3.7% |
| Hopi | 0.9 /100 | #263 | Tragic 3.6% |
| Immigrants | Cambodia | 0.9 /100 | #264 | Tragic 3.6% |
Demographics Similar to Argentineans by Professional Degree
In terms of professional degree, the demographic groups most similar to Argentineans are Immigrants from Saudi Arabia (5.9%, a difference of 0.16%), Immigrants from South Central Asia (5.9%, a difference of 0.45%), Estonian (6.0%, a difference of 0.48%), New Zealander (6.0%, a difference of 0.49%), and Immigrants from Argentina (5.9%, a difference of 0.65%).
| Demographics | Rating | Rank | Professional Degree |
| Immigrants | Austria | 100.0 /100 | #37 | Exceptional 6.0% |
| Immigrants | Norway | 100.0 /100 | #38 | Exceptional 6.0% |
| Immigrants | South Africa | 100.0 /100 | #39 | Exceptional 6.0% |
| Cambodians | 100.0 /100 | #40 | Exceptional 6.0% |
| New Zealanders | 100.0 /100 | #41 | Exceptional 6.0% |
| Estonians | 100.0 /100 | #42 | Exceptional 6.0% |
| Immigrants | Saudi Arabia | 100.0 /100 | #43 | Exceptional 5.9% |
| Argentineans | 100.0 /100 | #44 | Exceptional 5.9% |
| Immigrants | South Central Asia | 100.0 /100 | #45 | Exceptional 5.9% |
| Immigrants | Argentina | 100.0 /100 | #46 | Exceptional 5.9% |
| Australians | 100.0 /100 | #47 | Exceptional 5.9% |
| Paraguayans | 100.0 /100 | #48 | Exceptional 5.9% |
| Immigrants | Latvia | 100.0 /100 | #49 | Exceptional 5.8% |
| Immigrants | Czechoslovakia | 100.0 /100 | #50 | Exceptional 5.8% |
| Immigrants | Greece | 100.0 /100 | #51 | Exceptional 5.8% |