Austrian vs Immigrants from Russia 3rd Grade
COMPARE
Austrian
Immigrants from Russia
3rd Grade
3rd Grade Comparison
Austrians
Immigrants from Russia
98.3%
3RD GRADE
99.8/ 100
METRIC RATING
56th/ 347
METRIC RANK
97.8%
3RD GRADE
61.7/ 100
METRIC RATING
156th/ 347
METRIC RANK
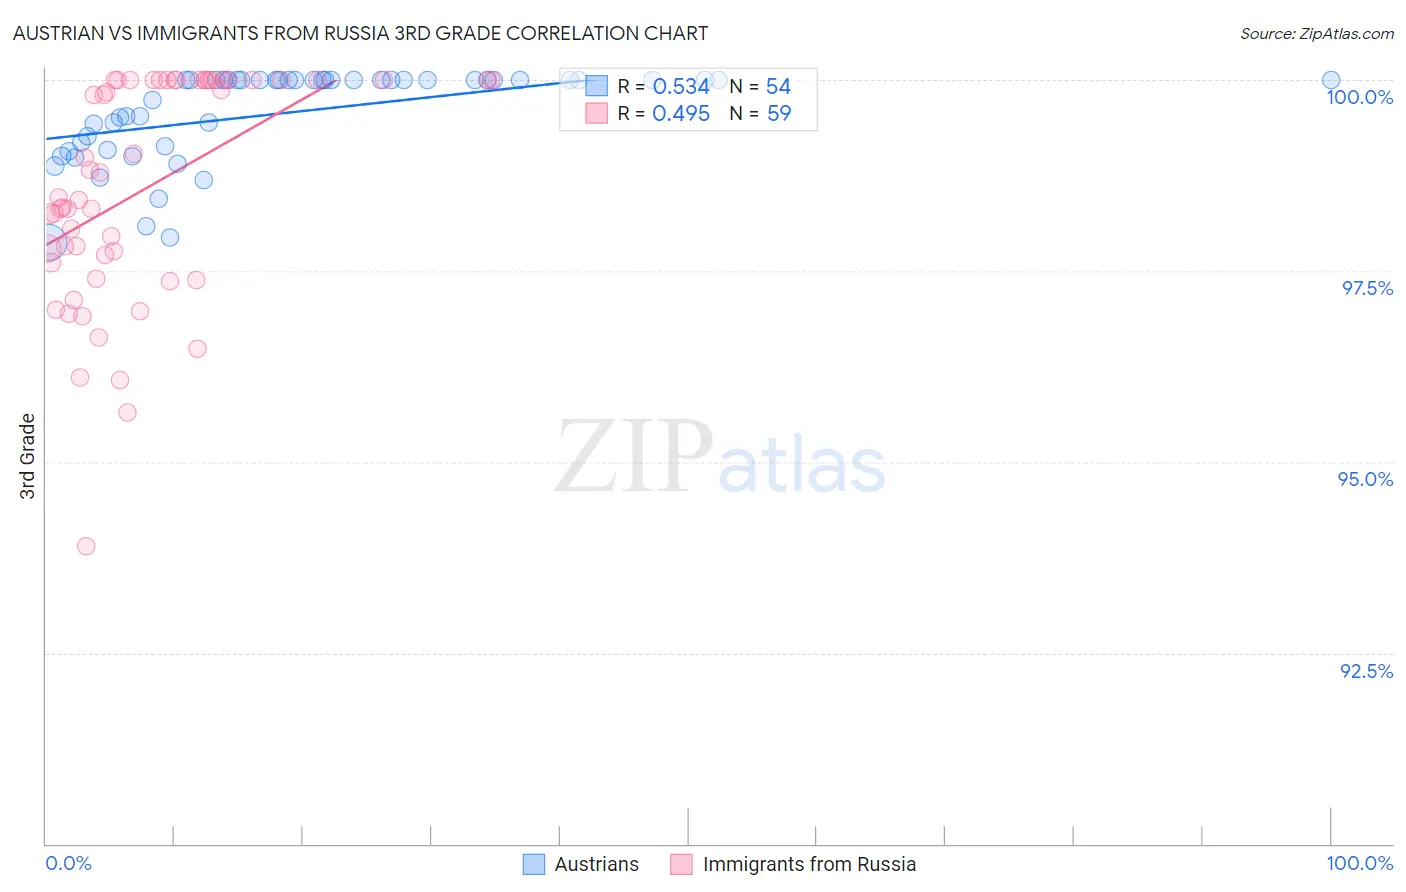
Austrian vs Immigrants from Russia 3rd Grade Correlation Chart
The statistical analysis conducted on geographies consisting of 452,080,536 people shows a substantial positive correlation between the proportion of Austrians and percentage of population with at least 3rd grade education in the United States with a correlation coefficient (R) of 0.534 and weighted average of 98.3%. Similarly, the statistical analysis conducted on geographies consisting of 347,948,494 people shows a moderate positive correlation between the proportion of Immigrants from Russia and percentage of population with at least 3rd grade education in the United States with a correlation coefficient (R) of 0.495 and weighted average of 97.8%, a difference of 0.47%.
3rd Grade Correlation Summary
| Measurement | Austrian | Immigrants from Russia |
| Minimum | 97.9% | 93.9% |
| Maximum | 100.0% | 100.0% |
| Range | 2.1% | 6.1% |
| Mean | 99.6% | 98.6% |
| Median | 100.0% | 98.5% |
| Interquartile 25% (IQ1) | 99.1% | 97.6% |
| Interquartile 75% (IQ3) | 100.0% | 100.0% |
| Interquartile Range (IQR) | 0.86% | 2.4% |
| Standard Deviation (Sample) | 0.60% | 1.5% |
| Standard Deviation (Population) | 0.60% | 1.4% |
Similar Demographics by 3rd Grade
Demographics Similar to Austrians by 3rd Grade
In terms of 3rd grade, the demographic groups most similar to Austrians are Bulgarian (98.3%, a difference of 0.0%), American (98.3%, a difference of 0.0%), Slavic (98.3%, a difference of 0.0%), Immigrants from Scotland (98.3%, a difference of 0.010%), and Greek (98.3%, a difference of 0.010%).
| Demographics | Rating | Rank | 3rd Grade |
| Estonians | 99.8 /100 | #49 | Exceptional 98.3% |
| Celtics | 99.8 /100 | #50 | Exceptional 98.3% |
| Australians | 99.8 /100 | #51 | Exceptional 98.3% |
| Whites/Caucasians | 99.8 /100 | #52 | Exceptional 98.3% |
| Immigrants | Scotland | 99.8 /100 | #53 | Exceptional 98.3% |
| Bulgarians | 99.8 /100 | #54 | Exceptional 98.3% |
| Americans | 99.8 /100 | #55 | Exceptional 98.3% |
| Austrians | 99.8 /100 | #56 | Exceptional 98.3% |
| Slavs | 99.7 /100 | #57 | Exceptional 98.3% |
| Greeks | 99.7 /100 | #58 | Exceptional 98.3% |
| Maltese | 99.7 /100 | #59 | Exceptional 98.3% |
| Creek | 99.7 /100 | #60 | Exceptional 98.2% |
| Pueblo | 99.7 /100 | #61 | Exceptional 98.2% |
| Immigrants | Canada | 99.7 /100 | #62 | Exceptional 98.2% |
| Immigrants | North America | 99.7 /100 | #63 | Exceptional 98.2% |
Demographics Similar to Immigrants from Russia by 3rd Grade
In terms of 3rd grade, the demographic groups most similar to Immigrants from Russia are Bermudan (97.8%, a difference of 0.0%), Immigrants from Italy (97.8%, a difference of 0.0%), Venezuelan (97.8%, a difference of 0.0%), Immigrants from Eastern Europe (97.8%, a difference of 0.010%), and French American Indian (97.8%, a difference of 0.010%).
| Demographics | Rating | Rank | 3rd Grade |
| Immigrants | North Macedonia | 74.5 /100 | #149 | Good 97.8% |
| Jordanians | 74.5 /100 | #150 | Good 97.8% |
| Soviet Union | 72.6 /100 | #151 | Good 97.8% |
| Immigrants | South Central Asia | 69.5 /100 | #152 | Good 97.8% |
| Apache | 68.5 /100 | #153 | Good 97.8% |
| Immigrants | Eastern Europe | 64.1 /100 | #154 | Good 97.8% |
| Bermudans | 62.6 /100 | #155 | Good 97.8% |
| Immigrants | Russia | 61.7 /100 | #156 | Good 97.8% |
| Immigrants | Italy | 61.2 /100 | #157 | Good 97.8% |
| Venezuelans | 60.9 /100 | #158 | Good 97.8% |
| French American Indians | 60.0 /100 | #159 | Average 97.8% |
| Immigrants | Iran | 59.1 /100 | #160 | Average 97.8% |
| Albanians | 58.8 /100 | #161 | Average 97.8% |
| Immigrants | Jordan | 57.9 /100 | #162 | Average 97.8% |
| Marshallese | 57.2 /100 | #163 | Average 97.8% |