Australian vs Thai 7th Grade
COMPARE
Australian
Thai
7th Grade
7th Grade Comparison
Australians
Thais
97.0%
7TH GRADE
99.8/ 100
METRIC RATING
54th/ 347
METRIC RANK
96.7%
7TH GRADE
98.6/ 100
METRIC RATING
101st/ 347
METRIC RANK
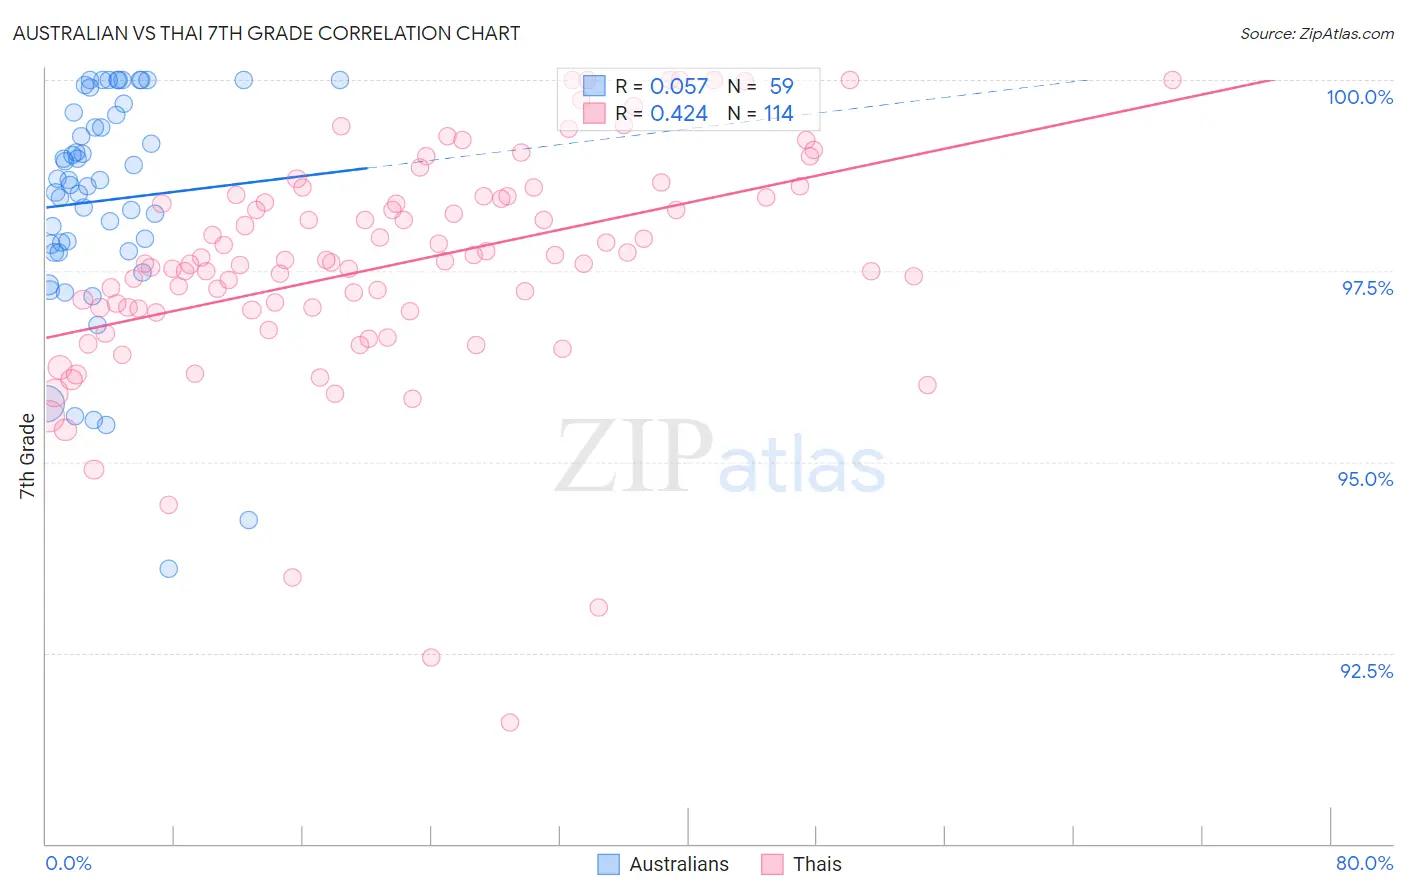
Australian vs Thai 7th Grade Correlation Chart
The statistical analysis conducted on geographies consisting of 224,153,693 people shows a slight positive correlation between the proportion of Australians and percentage of population with at least 7th grade education in the United States with a correlation coefficient (R) of 0.057 and weighted average of 97.0%. Similarly, the statistical analysis conducted on geographies consisting of 475,814,962 people shows a moderate positive correlation between the proportion of Thais and percentage of population with at least 7th grade education in the United States with a correlation coefficient (R) of 0.424 and weighted average of 96.7%, a difference of 0.33%.
7th Grade Correlation Summary
| Measurement | Australian | Thai |
| Minimum | 93.6% | 91.6% |
| Maximum | 100.0% | 100.0% |
| Range | 6.4% | 8.4% |
| Mean | 98.4% | 97.6% |
| Median | 98.7% | 97.6% |
| Interquartile 25% (IQ1) | 97.8% | 97.0% |
| Interquartile 75% (IQ3) | 99.6% | 98.5% |
| Interquartile Range (IQR) | 1.8% | 1.5% |
| Standard Deviation (Sample) | 1.5% | 1.5% |
| Standard Deviation (Population) | 1.5% | 1.5% |
Similar Demographics by 7th Grade
Demographics Similar to Australians by 7th Grade
In terms of 7th grade, the demographic groups most similar to Australians are Austrian (97.0%, a difference of 0.010%), Russian (97.0%, a difference of 0.010%), Serbian (97.0%, a difference of 0.010%), American (97.0%, a difference of 0.020%), and Greek (97.0%, a difference of 0.030%).
| Demographics | Rating | Rank | 7th Grade |
| Bulgarians | 99.9 /100 | #47 | Exceptional 97.1% |
| Celtics | 99.9 /100 | #48 | Exceptional 97.1% |
| Slavs | 99.9 /100 | #49 | Exceptional 97.1% |
| Immigrants | Scotland | 99.9 /100 | #50 | Exceptional 97.1% |
| Estonians | 99.9 /100 | #51 | Exceptional 97.0% |
| Greeks | 99.9 /100 | #52 | Exceptional 97.0% |
| Austrians | 99.8 /100 | #53 | Exceptional 97.0% |
| Australians | 99.8 /100 | #54 | Exceptional 97.0% |
| Russians | 99.8 /100 | #55 | Exceptional 97.0% |
| Serbians | 99.8 /100 | #56 | Exceptional 97.0% |
| Americans | 99.8 /100 | #57 | Exceptional 97.0% |
| Whites/Caucasians | 99.8 /100 | #58 | Exceptional 97.0% |
| Macedonians | 99.8 /100 | #59 | Exceptional 97.0% |
| Immigrants | Canada | 99.8 /100 | #60 | Exceptional 96.9% |
| Creek | 99.8 /100 | #61 | Exceptional 96.9% |
Demographics Similar to Thais by 7th Grade
In terms of 7th grade, the demographic groups most similar to Thais are German Russian (96.7%, a difference of 0.0%), Immigrants from Denmark (96.7%, a difference of 0.010%), Immigrants from Germany (96.7%, a difference of 0.010%), Immigrants from Sweden (96.7%, a difference of 0.010%), and Menominee (96.7%, a difference of 0.010%).
| Demographics | Rating | Rank | 7th Grade |
| Lebanese | 98.8 /100 | #94 | Exceptional 96.7% |
| Immigrants | Australia | 98.8 /100 | #95 | Exceptional 96.7% |
| Immigrants | Denmark | 98.7 /100 | #96 | Exceptional 96.7% |
| Immigrants | Germany | 98.7 /100 | #97 | Exceptional 96.7% |
| Immigrants | Sweden | 98.7 /100 | #98 | Exceptional 96.7% |
| Menominee | 98.7 /100 | #99 | Exceptional 96.7% |
| German Russians | 98.6 /100 | #100 | Exceptional 96.7% |
| Thais | 98.6 /100 | #101 | Exceptional 96.7% |
| Immigrants | Czechoslovakia | 98.3 /100 | #102 | Exceptional 96.6% |
| Immigrants | Singapore | 98.3 /100 | #103 | Exceptional 96.6% |
| Shoshone | 98.1 /100 | #104 | Exceptional 96.6% |
| South Africans | 98.0 /100 | #105 | Exceptional 96.6% |
| Iroquois | 97.9 /100 | #106 | Exceptional 96.6% |
| Lumbee | 97.8 /100 | #107 | Exceptional 96.6% |
| Immigrants | Saudi Arabia | 97.8 /100 | #108 | Exceptional 96.6% |