Australian vs Hispanic or Latino 11th Grade
COMPARE
Australian
Hispanic or Latino
11th Grade
11th Grade Comparison
Australians
Hispanics or Latinos
94.1%
11TH GRADE
99.9/ 100
METRIC RATING
45th/ 347
METRIC RANK
87.3%
11TH GRADE
0.0/ 100
METRIC RATING
331st/ 347
METRIC RANK
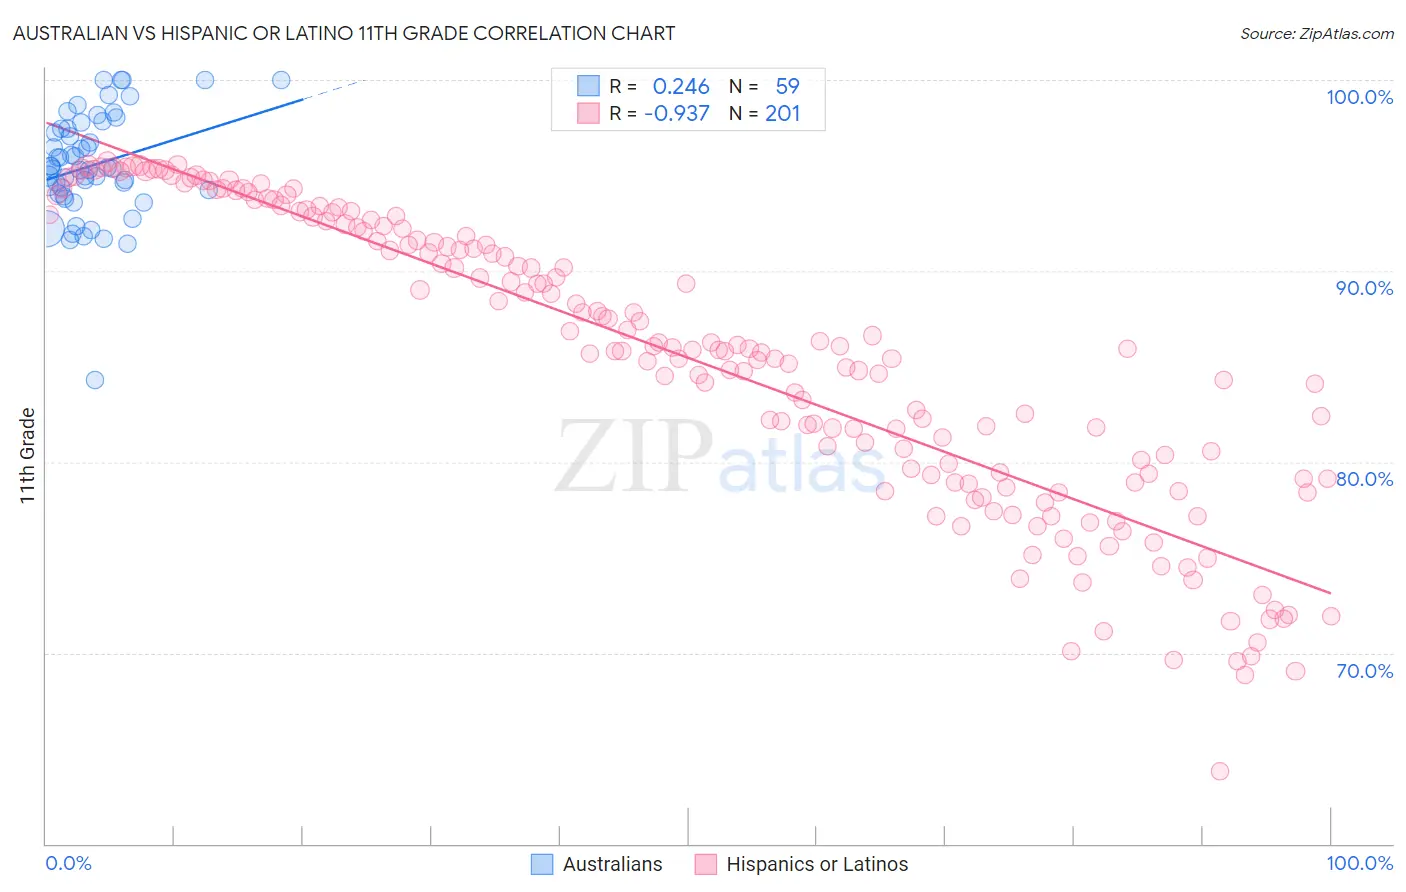
Australian vs Hispanic or Latino 11th Grade Correlation Chart
The statistical analysis conducted on geographies consisting of 224,153,693 people shows a weak positive correlation between the proportion of Australians and percentage of population with at least 11th grade education in the United States with a correlation coefficient (R) of 0.246 and weighted average of 94.1%. Similarly, the statistical analysis conducted on geographies consisting of 578,613,877 people shows a near-perfect negative correlation between the proportion of Hispanics or Latinos and percentage of population with at least 11th grade education in the United States with a correlation coefficient (R) of -0.937 and weighted average of 87.3%, a difference of 7.8%.
11th Grade Correlation Summary
| Measurement | Australian | Hispanic or Latino |
| Minimum | 84.3% | 63.8% |
| Maximum | 100.0% | 95.7% |
| Range | 15.7% | 31.9% |
| Mean | 95.5% | 85.4% |
| Median | 95.4% | 85.9% |
| Interquartile 25% (IQ1) | 94.0% | 79.2% |
| Interquartile 75% (IQ3) | 97.4% | 92.4% |
| Interquartile Range (IQR) | 3.4% | 13.2% |
| Standard Deviation (Sample) | 2.8% | 7.7% |
| Standard Deviation (Population) | 2.8% | 7.6% |
Similar Demographics by 11th Grade
Demographics Similar to Australians by 11th Grade
In terms of 11th grade, the demographic groups most similar to Australians are Immigrants from Ireland (94.1%, a difference of 0.010%), Serbian (94.1%, a difference of 0.010%), Greek (94.1%, a difference of 0.020%), Filipino (94.1%, a difference of 0.020%), and Macedonian (94.1%, a difference of 0.020%).
| Demographics | Rating | Rank | 11th Grade |
| Hungarians | 99.9 /100 | #38 | Exceptional 94.2% |
| Immigrants | Lithuania | 99.9 /100 | #39 | Exceptional 94.1% |
| Thais | 99.9 /100 | #40 | Exceptional 94.1% |
| Cypriots | 99.9 /100 | #41 | Exceptional 94.1% |
| Immigrants | Austria | 99.9 /100 | #42 | Exceptional 94.1% |
| Greeks | 99.9 /100 | #43 | Exceptional 94.1% |
| Immigrants | Ireland | 99.9 /100 | #44 | Exceptional 94.1% |
| Australians | 99.9 /100 | #45 | Exceptional 94.1% |
| Serbians | 99.9 /100 | #46 | Exceptional 94.1% |
| Filipinos | 99.9 /100 | #47 | Exceptional 94.1% |
| Macedonians | 99.9 /100 | #48 | Exceptional 94.1% |
| Slavs | 99.9 /100 | #49 | Exceptional 94.1% |
| French | 99.9 /100 | #50 | Exceptional 94.1% |
| Turks | 99.9 /100 | #51 | Exceptional 94.0% |
| Immigrants | Canada | 99.9 /100 | #52 | Exceptional 94.0% |
Demographics Similar to Hispanics or Latinos by 11th Grade
In terms of 11th grade, the demographic groups most similar to Hispanics or Latinos are Honduran (87.4%, a difference of 0.060%), Immigrants from the Azores (87.2%, a difference of 0.090%), Mexican American Indian (87.5%, a difference of 0.25%), Immigrants from Yemen (87.1%, a difference of 0.26%), and Tohono O'odham (87.6%, a difference of 0.32%).
| Demographics | Rating | Rank | 11th Grade |
| Central American Indians | 0.0 /100 | #324 | Tragic 88.2% |
| Immigrants | Nicaragua | 0.0 /100 | #325 | Tragic 88.1% |
| Dominicans | 0.0 /100 | #326 | Tragic 87.7% |
| Immigrants | Cabo Verde | 0.0 /100 | #327 | Tragic 87.6% |
| Tohono O'odham | 0.0 /100 | #328 | Tragic 87.6% |
| Mexican American Indians | 0.0 /100 | #329 | Tragic 87.5% |
| Hondurans | 0.0 /100 | #330 | Tragic 87.4% |
| Hispanics or Latinos | 0.0 /100 | #331 | Tragic 87.3% |
| Immigrants | Azores | 0.0 /100 | #332 | Tragic 87.2% |
| Immigrants | Yemen | 0.0 /100 | #333 | Tragic 87.1% |
| Houma | 0.0 /100 | #334 | Tragic 87.0% |
| Central Americans | 0.0 /100 | #335 | Tragic 86.9% |
| Immigrants | Dominican Republic | 0.0 /100 | #336 | Tragic 86.9% |
| Immigrants | Honduras | 0.0 /100 | #337 | Tragic 86.9% |
| Immigrants | Latin America | 0.0 /100 | #338 | Tragic 86.8% |