Asian vs Arapaho 9th Grade
COMPARE
Asian
Arapaho
9th Grade
9th Grade Comparison
Asians
Arapaho
94.5%
9TH GRADE
9.9/ 100
METRIC RATING
217th/ 347
METRIC RANK
95.7%
9TH GRADE
99.3/ 100
METRIC RATING
81st/ 347
METRIC RANK
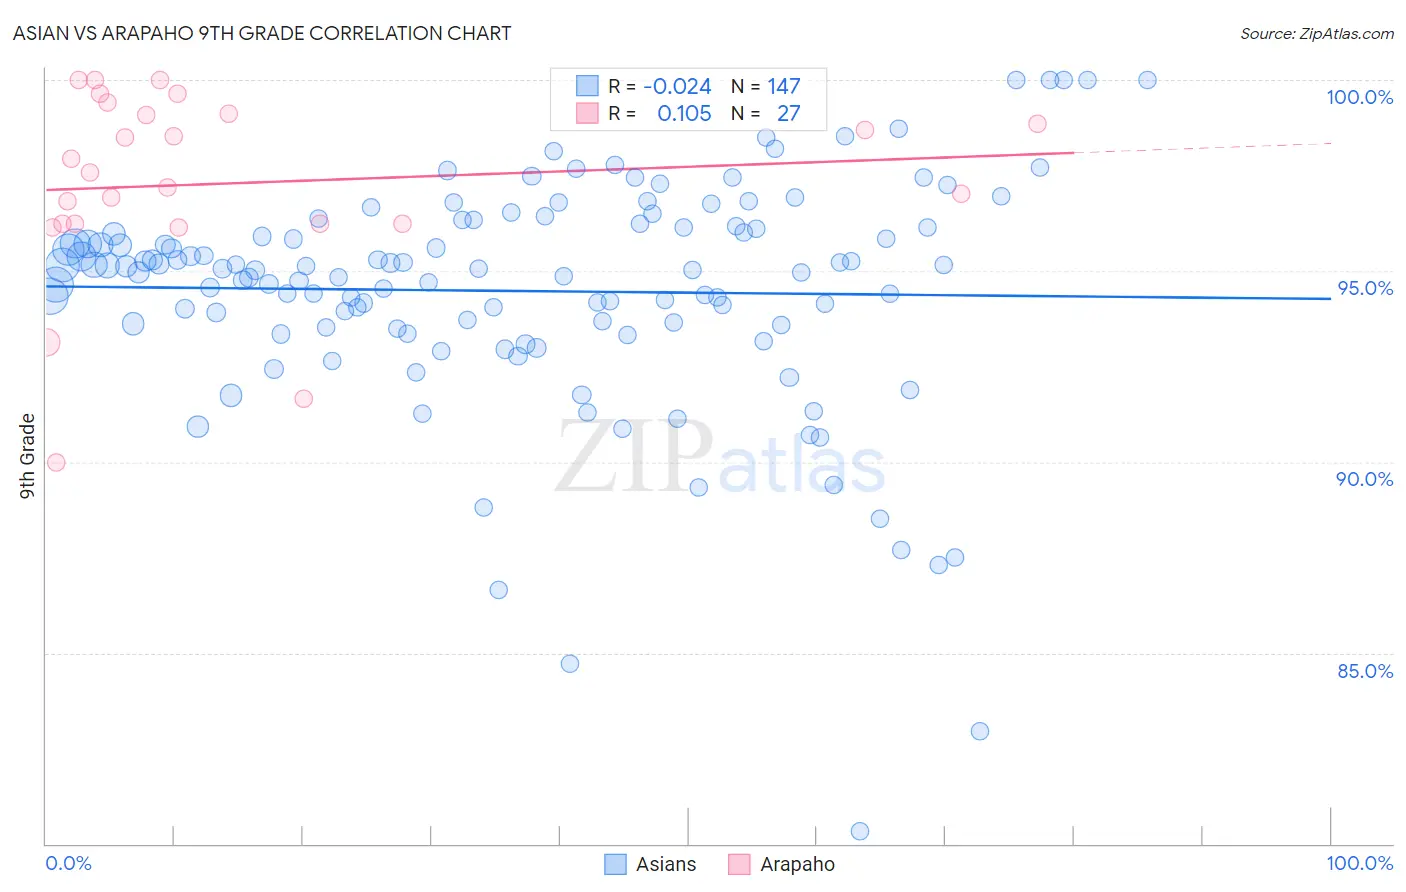
Asian vs Arapaho 9th Grade Correlation Chart
The statistical analysis conducted on geographies consisting of 550,857,622 people shows no correlation between the proportion of Asians and percentage of population with at least 9th grade education in the United States with a correlation coefficient (R) of -0.024 and weighted average of 94.5%. Similarly, the statistical analysis conducted on geographies consisting of 29,780,325 people shows a poor positive correlation between the proportion of Arapaho and percentage of population with at least 9th grade education in the United States with a correlation coefficient (R) of 0.105 and weighted average of 95.7%, a difference of 1.3%.
9th Grade Correlation Summary
| Measurement | Asian | Arapaho |
| Minimum | 80.3% | 90.0% |
| Maximum | 100.0% | 100.0% |
| Range | 19.7% | 10.0% |
| Mean | 94.5% | 97.3% |
| Median | 95.0% | 97.6% |
| Interquartile 25% (IQ1) | 93.5% | 96.2% |
| Interquartile 75% (IQ3) | 96.2% | 99.1% |
| Interquartile Range (IQR) | 2.6% | 2.9% |
| Standard Deviation (Sample) | 3.0% | 2.5% |
| Standard Deviation (Population) | 3.0% | 2.4% |
Similar Demographics by 9th Grade
Demographics Similar to Asians by 9th Grade
In terms of 9th grade, the demographic groups most similar to Asians are Portuguese (94.5%, a difference of 0.010%), Immigrants from Syria (94.5%, a difference of 0.020%), Immigrants from Western Asia (94.5%, a difference of 0.020%), African (94.5%, a difference of 0.020%), and Indian (Asian) (94.5%, a difference of 0.030%).
| Demographics | Rating | Rank | 9th Grade |
| Immigrants | Chile | 13.4 /100 | #210 | Poor 94.5% |
| Immigrants | Indonesia | 12.3 /100 | #211 | Poor 94.5% |
| Immigrants | Malaysia | 12.2 /100 | #212 | Poor 94.5% |
| Immigrants | Oceania | 12.1 /100 | #213 | Poor 94.5% |
| Immigrants | Liberia | 11.8 /100 | #214 | Poor 94.5% |
| Immigrants | Syria | 11.0 /100 | #215 | Poor 94.5% |
| Immigrants | Western Asia | 10.7 /100 | #216 | Poor 94.5% |
| Asians | 9.9 /100 | #217 | Tragic 94.5% |
| Portuguese | 9.2 /100 | #218 | Tragic 94.5% |
| Africans | 9.0 /100 | #219 | Tragic 94.5% |
| Indians (Asian) | 8.6 /100 | #220 | Tragic 94.5% |
| Immigrants | Eastern Africa | 8.2 /100 | #221 | Tragic 94.5% |
| Immigrants | Asia | 7.7 /100 | #222 | Tragic 94.4% |
| Bahamians | 7.0 /100 | #223 | Tragic 94.4% |
| Tongans | 6.0 /100 | #224 | Tragic 94.4% |
Demographics Similar to Arapaho by 9th Grade
In terms of 9th grade, the demographic groups most similar to Arapaho are Bhutanese (95.7%, a difference of 0.0%), Puget Sound Salish (95.7%, a difference of 0.0%), Romanian (95.7%, a difference of 0.020%), Swiss (95.7%, a difference of 0.020%), and Immigrants from Denmark (95.7%, a difference of 0.030%).
| Demographics | Rating | Rank | 9th Grade |
| Thais | 99.5 /100 | #74 | Exceptional 95.8% |
| Inupiat | 99.5 /100 | #75 | Exceptional 95.8% |
| Immigrants | Sweden | 99.5 /100 | #76 | Exceptional 95.8% |
| Whites/Caucasians | 99.4 /100 | #77 | Exceptional 95.8% |
| Immigrants | South Africa | 99.4 /100 | #78 | Exceptional 95.8% |
| Romanians | 99.3 /100 | #79 | Exceptional 95.7% |
| Bhutanese | 99.3 /100 | #80 | Exceptional 95.7% |
| Arapaho | 99.3 /100 | #81 | Exceptional 95.7% |
| Puget Sound Salish | 99.2 /100 | #82 | Exceptional 95.7% |
| Swiss | 99.2 /100 | #83 | Exceptional 95.7% |
| Immigrants | Denmark | 99.1 /100 | #84 | Exceptional 95.7% |
| Icelanders | 99.1 /100 | #85 | Exceptional 95.7% |
| Immigrants | Western Europe | 99.1 /100 | #86 | Exceptional 95.7% |
| Okinawans | 99.0 /100 | #87 | Exceptional 95.7% |
| Immigrants | Czechoslovakia | 98.9 /100 | #88 | Exceptional 95.7% |