Armenian vs Hispanic or Latino 12th Grade, No Diploma
COMPARE
Armenian
Hispanic or Latino
12th Grade, No Diploma
12th Grade, No Diploma Comparison
Armenians
Hispanics or Latinos
90.6%
12TH GRADE, NO DIPLOMA
11.6/ 100
METRIC RATING
207th/ 347
METRIC RANK
85.4%
12TH GRADE, NO DIPLOMA
0.0/ 100
METRIC RATING
329th/ 347
METRIC RANK
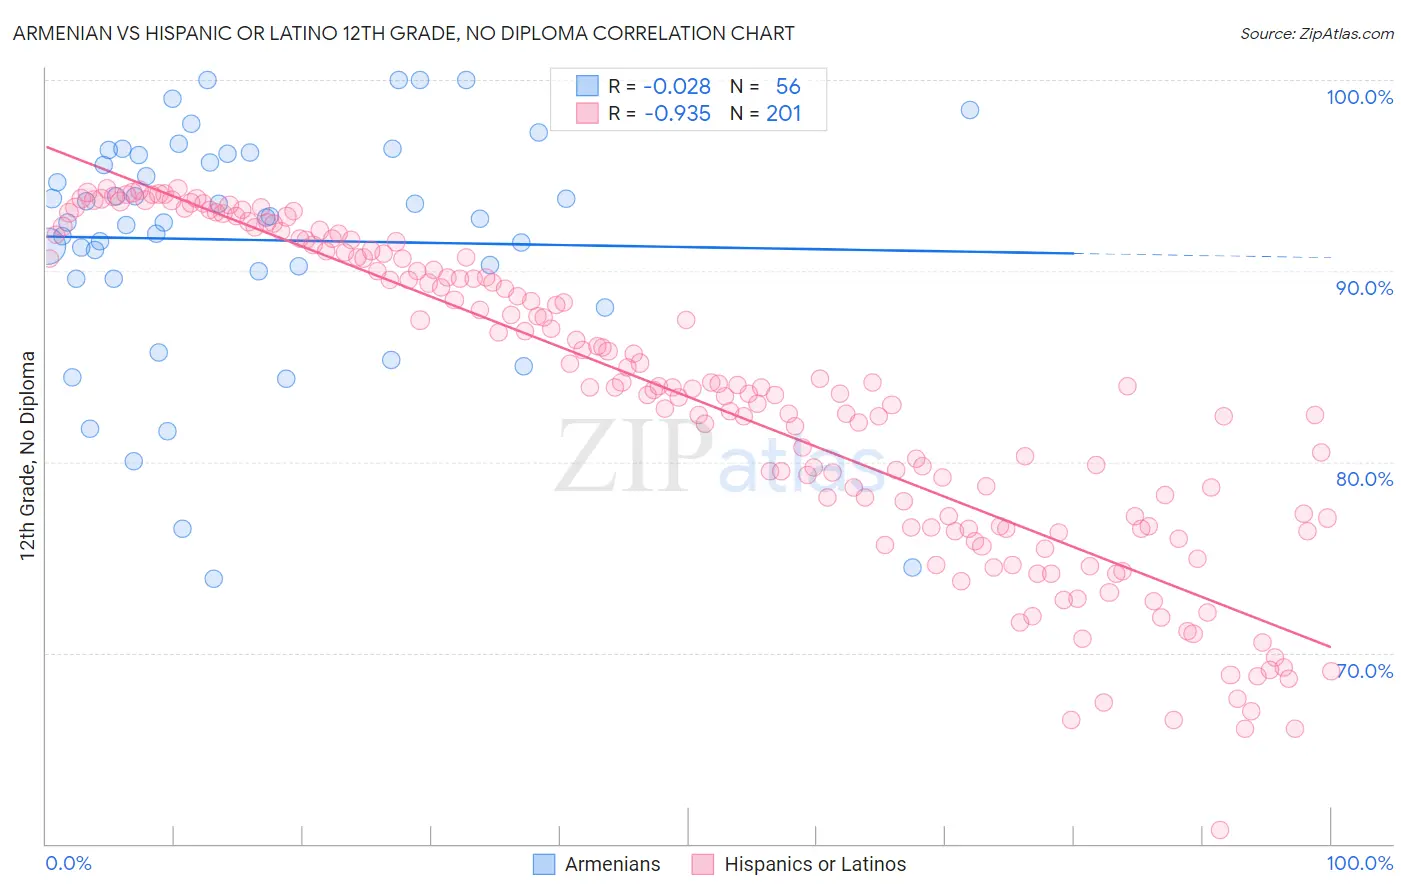
Armenian vs Hispanic or Latino 12th Grade, No Diploma Correlation Chart
The statistical analysis conducted on geographies consisting of 310,954,685 people shows no correlation between the proportion of Armenians and percentage of population with at least 12th grade (no diploma) education in the United States with a correlation coefficient (R) of -0.028 and weighted average of 90.6%. Similarly, the statistical analysis conducted on geographies consisting of 578,613,277 people shows a near-perfect negative correlation between the proportion of Hispanics or Latinos and percentage of population with at least 12th grade (no diploma) education in the United States with a correlation coefficient (R) of -0.935 and weighted average of 85.4%, a difference of 6.0%.
12th Grade, No Diploma Correlation Summary
| Measurement | Armenian | Hispanic or Latino |
| Minimum | 73.9% | 60.7% |
| Maximum | 100.0% | 94.3% |
| Range | 26.1% | 33.6% |
| Mean | 91.6% | 83.3% |
| Median | 92.7% | 83.9% |
| Interquartile 25% (IQ1) | 89.8% | 76.6% |
| Interquartile 75% (IQ3) | 96.1% | 90.8% |
| Interquartile Range (IQR) | 6.3% | 14.2% |
| Standard Deviation (Sample) | 6.2% | 8.2% |
| Standard Deviation (Population) | 6.1% | 8.1% |
Similar Demographics by 12th Grade, No Diploma
Demographics Similar to Armenians by 12th Grade, No Diploma
In terms of 12th grade, no diploma, the demographic groups most similar to Armenians are Immigrants from Bolivia (90.6%, a difference of 0.020%), Immigrants from Micronesia (90.6%, a difference of 0.020%), Immigrants from Afghanistan (90.6%, a difference of 0.020%), South American Indian (90.6%, a difference of 0.020%), and Portuguese (90.6%, a difference of 0.030%).
| Demographics | Rating | Rank | 12th Grade, No Diploma |
| Liberians | 19.8 /100 | #200 | Poor 90.8% |
| Hawaiians | 19.7 /100 | #201 | Poor 90.8% |
| Marshallese | 18.2 /100 | #202 | Poor 90.7% |
| Tongans | 16.1 /100 | #203 | Poor 90.7% |
| French American Indians | 15.5 /100 | #204 | Poor 90.7% |
| Immigrants | Sierra Leone | 14.9 /100 | #205 | Poor 90.7% |
| Immigrants | Bolivia | 12.3 /100 | #206 | Poor 90.6% |
| Armenians | 11.6 /100 | #207 | Poor 90.6% |
| Immigrants | Micronesia | 11.0 /100 | #208 | Poor 90.6% |
| Immigrants | Afghanistan | 11.0 /100 | #209 | Poor 90.6% |
| South American Indians | 10.9 /100 | #210 | Poor 90.6% |
| Portuguese | 10.6 /100 | #211 | Poor 90.6% |
| Somalis | 10.2 /100 | #212 | Poor 90.6% |
| Costa Ricans | 9.4 /100 | #213 | Tragic 90.5% |
| Immigrants | Africa | 8.5 /100 | #214 | Tragic 90.5% |
Demographics Similar to Hispanics or Latinos by 12th Grade, No Diploma
In terms of 12th grade, no diploma, the demographic groups most similar to Hispanics or Latinos are Honduran (85.5%, a difference of 0.090%), Immigrants from the Azores (85.3%, a difference of 0.14%), Lumbee (85.7%, a difference of 0.28%), Central American (85.2%, a difference of 0.28%), and Dominican (85.7%, a difference of 0.30%).
| Demographics | Rating | Rank | 12th Grade, No Diploma |
| Central American Indians | 0.0 /100 | #322 | Tragic 86.5% |
| Yuman | 0.0 /100 | #323 | Tragic 86.5% |
| Immigrants | Cabo Verde | 0.0 /100 | #324 | Tragic 85.8% |
| Mexican American Indians | 0.0 /100 | #325 | Tragic 85.7% |
| Dominicans | 0.0 /100 | #326 | Tragic 85.7% |
| Lumbee | 0.0 /100 | #327 | Tragic 85.7% |
| Hondurans | 0.0 /100 | #328 | Tragic 85.5% |
| Hispanics or Latinos | 0.0 /100 | #329 | Tragic 85.4% |
| Immigrants | Azores | 0.0 /100 | #330 | Tragic 85.3% |
| Central Americans | 0.0 /100 | #331 | Tragic 85.2% |
| Immigrants | Honduras | 0.0 /100 | #332 | Tragic 85.0% |
| Immigrants | Latin America | 0.0 /100 | #333 | Tragic 85.0% |
| Immigrants | Dominican Republic | 0.0 /100 | #334 | Tragic 84.9% |
| Immigrants | Yemen | 0.0 /100 | #335 | Tragic 84.8% |
| Tohono O'odham | 0.0 /100 | #336 | Tragic 84.7% |