Argentinean vs Immigrants from Ukraine Professional Degree
COMPARE
Argentinean
Immigrants from Ukraine
Professional Degree
Professional Degree Comparison
Argentineans
Immigrants from Ukraine
5.9%
PROFESSIONAL DEGREE
100.0/ 100
METRIC RATING
44th/ 347
METRIC RANK
5.0%
PROFESSIONAL DEGREE
98.2/ 100
METRIC RATING
106th/ 347
METRIC RANK
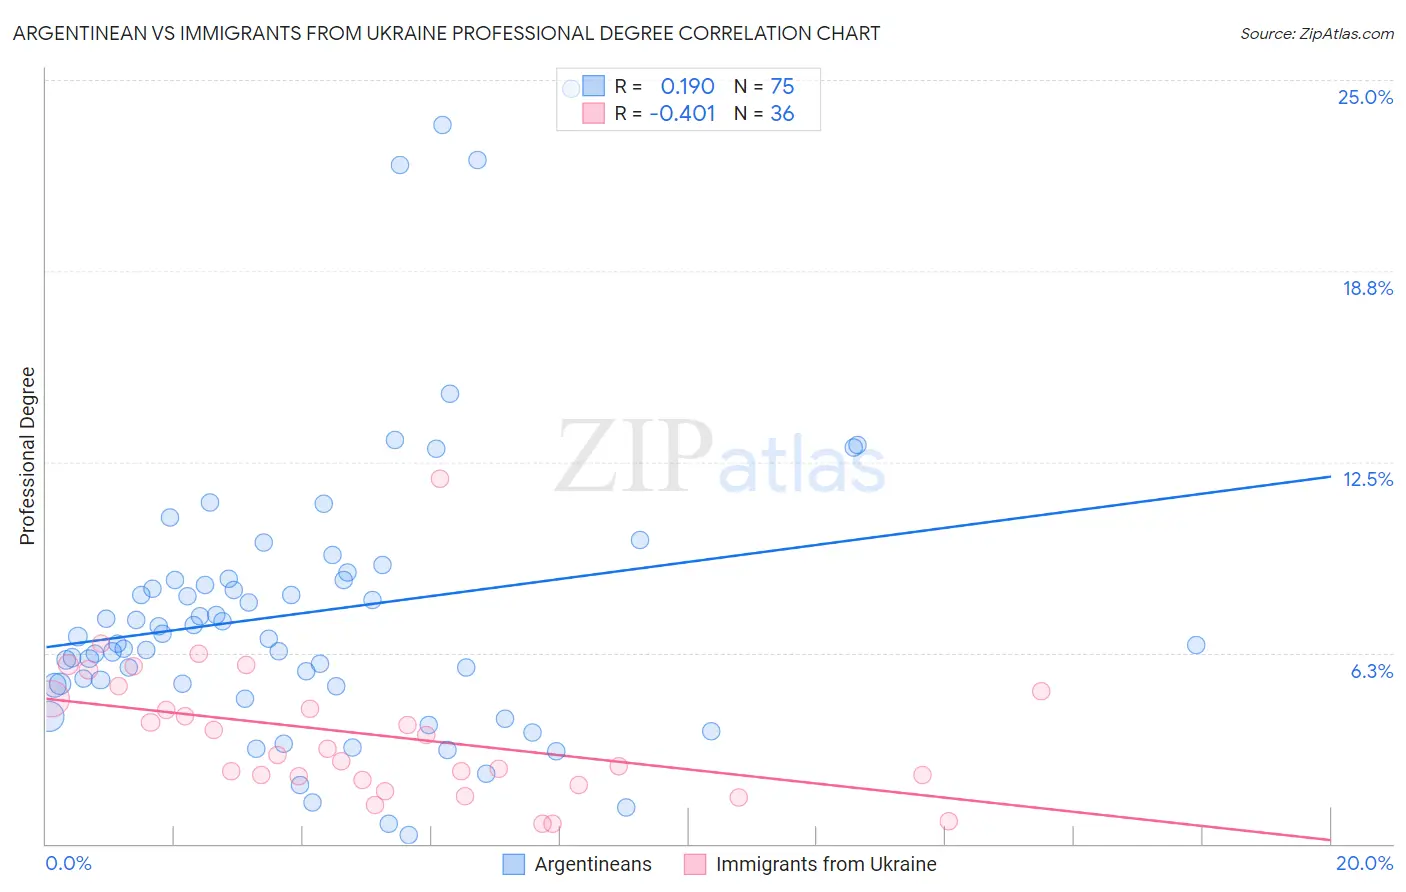
Argentinean vs Immigrants from Ukraine Professional Degree Correlation Chart
The statistical analysis conducted on geographies consisting of 296,877,739 people shows a poor positive correlation between the proportion of Argentineans and percentage of population with at least professional degree education in the United States with a correlation coefficient (R) of 0.190 and weighted average of 5.9%. Similarly, the statistical analysis conducted on geographies consisting of 289,430,858 people shows a moderate negative correlation between the proportion of Immigrants from Ukraine and percentage of population with at least professional degree education in the United States with a correlation coefficient (R) of -0.401 and weighted average of 5.0%, a difference of 17.5%.
Professional Degree Correlation Summary
| Measurement | Argentinean | Immigrants from Ukraine |
| Minimum | 0.30% | 0.65% |
| Maximum | 24.7% | 12.0% |
| Range | 24.4% | 11.3% |
| Mean | 7.6% | 3.6% |
| Median | 6.7% | 3.0% |
| Interquartile 25% (IQ1) | 5.2% | 2.1% |
| Interquartile 75% (IQ3) | 8.7% | 4.9% |
| Interquartile Range (IQR) | 3.5% | 2.7% |
| Standard Deviation (Sample) | 4.8% | 2.2% |
| Standard Deviation (Population) | 4.8% | 2.2% |
Similar Demographics by Professional Degree
Demographics Similar to Argentineans by Professional Degree
In terms of professional degree, the demographic groups most similar to Argentineans are Immigrants from Saudi Arabia (5.9%, a difference of 0.16%), Immigrants from South Central Asia (5.9%, a difference of 0.45%), Estonian (6.0%, a difference of 0.48%), New Zealander (6.0%, a difference of 0.49%), and Immigrants from Argentina (5.9%, a difference of 0.65%).
| Demographics | Rating | Rank | Professional Degree |
| Immigrants | Austria | 100.0 /100 | #37 | Exceptional 6.0% |
| Immigrants | Norway | 100.0 /100 | #38 | Exceptional 6.0% |
| Immigrants | South Africa | 100.0 /100 | #39 | Exceptional 6.0% |
| Cambodians | 100.0 /100 | #40 | Exceptional 6.0% |
| New Zealanders | 100.0 /100 | #41 | Exceptional 6.0% |
| Estonians | 100.0 /100 | #42 | Exceptional 6.0% |
| Immigrants | Saudi Arabia | 100.0 /100 | #43 | Exceptional 5.9% |
| Argentineans | 100.0 /100 | #44 | Exceptional 5.9% |
| Immigrants | South Central Asia | 100.0 /100 | #45 | Exceptional 5.9% |
| Immigrants | Argentina | 100.0 /100 | #46 | Exceptional 5.9% |
| Australians | 100.0 /100 | #47 | Exceptional 5.9% |
| Paraguayans | 100.0 /100 | #48 | Exceptional 5.9% |
| Immigrants | Latvia | 100.0 /100 | #49 | Exceptional 5.8% |
| Immigrants | Czechoslovakia | 100.0 /100 | #50 | Exceptional 5.8% |
| Immigrants | Greece | 100.0 /100 | #51 | Exceptional 5.8% |
Demographics Similar to Immigrants from Ukraine by Professional Degree
In terms of professional degree, the demographic groups most similar to Immigrants from Ukraine are Immigrants from Uganda (5.0%, a difference of 0.030%), Arab (5.0%, a difference of 0.050%), Maltese (5.0%, a difference of 0.12%), Immigrants from Southern Europe (5.0%, a difference of 0.16%), and British (5.0%, a difference of 0.18%).
| Demographics | Rating | Rank | Professional Degree |
| Immigrants | Italy | 99.1 /100 | #99 | Exceptional 5.2% |
| Ugandans | 98.8 /100 | #100 | Exceptional 5.1% |
| Immigrants | Egypt | 98.5 /100 | #101 | Exceptional 5.1% |
| Ukrainians | 98.5 /100 | #102 | Exceptional 5.1% |
| Immigrants | Northern Africa | 98.4 /100 | #103 | Exceptional 5.1% |
| Arabs | 98.2 /100 | #104 | Exceptional 5.0% |
| Immigrants | Uganda | 98.2 /100 | #105 | Exceptional 5.0% |
| Immigrants | Ukraine | 98.2 /100 | #106 | Exceptional 5.0% |
| Maltese | 98.1 /100 | #107 | Exceptional 5.0% |
| Immigrants | Southern Europe | 98.1 /100 | #108 | Exceptional 5.0% |
| British | 98.0 /100 | #109 | Exceptional 5.0% |
| Lebanese | 98.0 /100 | #110 | Exceptional 5.0% |
| Brazilians | 97.4 /100 | #111 | Exceptional 5.0% |
| Taiwanese | 97.3 /100 | #112 | Exceptional 5.0% |
| Immigrants | Pakistan | 97.2 /100 | #113 | Exceptional 5.0% |