Arapaho vs Immigrants from Iraq Master's Degree

COMPARE

Arapaho
Race
Ancestry
AfghanAfricanAlaska NativeAlaskan AthabascanAlbanianAleutAlsatianAmericanApacheArabArapahoArgentineanArmenianAssyrian/Chaldean/SyriacAustralianAustrianBahamianBangladeshiBarbadianBasqueBelgianBelizeanBermudanBhutaneseBlackfeetBolivianBrazilianBritishBritish West IndianBulgarianBurmeseCajunCambodianCanadianCape VerdeanCarpatho RusynCelticCentral AmericanCentral American IndianCherokeeCheyenneChickasawChileanChineseChippewaChoctawColombianColvilleComancheCosta RicanCreeCreekCroatianCrowCubanCypriotCzechCzechoslovakianDanishDelawareDominicanDutchDutch West IndianEastern EuropeanEcuadorianEgyptianEnglishEstonianEthiopianEuropeanFijianFilipinoFinnishFrenchFrench American IndianFrench CanadianGermanGerman RussianGhanaianGreekGuamanian/ChamorroGuatemalanGuyaneseHaitianHmongHonduranHopiHoumaHungarianIcelanderIndian (Asian)IndonesianInupiatIranianIraqiIrishIroquoisIsraeliItalianJamaicanJapaneseJordanianKenyanKiowaKoreanLaotianLatvianLebaneseLiberianLithuanianLumbeeLuxembourgerMacedonianMalaysianMalteseMarshalleseMenomineeMexicanMexican American IndianMongolianMoroccanNative HawaiianNavajoNepaleseNew ZealanderNicaraguanNigerianNorthern EuropeanNorwegianOkinawanOsageOttawaPaiutePakistaniPalestinianPanamanianParaguayanPennsylvania GermanPeruvianPimaPolishPortuguesePotawatomiPuebloPuerto RicanPuget Sound SalishRomanianRussianSalvadoranSamoanScandinavianScotch-IrishScottishSeminoleSenegaleseSerbianShoshoneSierra LeoneanSiouxSlavicSlovakSloveneSomaliSouth AfricanSouth AmericanSouth American IndianSoviet UnionSpaniardSpanishSpanish AmericanSpanish American IndianSri LankanSubsaharan AfricanSudaneseSwedishSwissSyrianTaiwaneseThaiTlingit-HaidaTohono O'OdhamTonganTrinidadian and TobagonianTsimshianTurkishU.S. Virgin IslanderUgandanUkrainianUruguayanUteVenezuelanVietnameseWelshWest IndianYakamaYaquiYugoslavianYumanYup'ikZimbabwean
Immigration
NonimmigrantsImmigrantsAfghanistanAfricaAlbaniaArgentinaArmeniaAsiaAustraliaAustriaBahamasBangladeshBarbadosBelarusBelgiumBelizeBoliviaBosnia and HerzegovinaBrazilBulgariaBurma/MyanmarCabo VerdeCambodiaCameroonCanadaCaribbeanCentral AmericaChileChinaColombiaCongoCosta RicaCroatiaCubaCzechoslovakiaDenmarkDominicaDominican RepublicEastern AfricaEastern AsiaEastern EuropeEcuadorEgyptEl SalvadorEnglandEritreaEthiopiaEuropeFijiFranceGermanyGhanaGreeceGrenadaGuatemalaGuyanaHaitiHondurasHong KongHungaryIndiaIndonesiaIranIrelandIsraelItalyJamaicaJapanJordanKazakhstanKenyaKoreaKuwaitLaosLatin AmericaLatviaLebanonLiberiaLithuaniaMalaysiaMexicoMicronesiaMiddle AfricaMoldovaMoroccoNepalNetherlandsNicaraguaNigeriaNorth AmericaNorth MacedoniaNorthern AfricaNorthern EuropeNorwayOceaniaPakistanPanamaPeruPhilippinesPolandPortugalRomaniaRussiaSaudi ArabiaScotlandSenegalSerbiaSierra LeoneSingaporeSomaliaSouth AfricaSouth AmericaSouth Central AsiaSouth Eastern AsiaSouthern EuropeSpainSri LankaSt. Vincent and the GrenadinesSudanSwedenSwitzerlandSyriaTaiwanThailandTrinidad and TobagoTurkeyUgandaUkraineUruguayUzbekistanVenezuelaVietnamWest IndiesWestern AfricaWestern AsiaWestern EuropeYemenZaireZimbabweAzores
Immigrants from Iraq
Race
Ancestry
AfghanAfricanAlaska NativeAlaskan AthabascanAlbanianAleutAlsatianAmericanApacheArabArgentineanArmenianAssyrian/Chaldean/SyriacAustralianAustrianBahamianBangladeshiBarbadianBasqueBelgianBelizeanBermudanBhutaneseBlackfeetBolivianBrazilianBritishBritish West IndianBulgarianBurmeseCajunCambodianCanadianCape VerdeanCarpatho RusynCelticCentral AmericanCentral American IndianCherokeeCheyenneChickasawChileanChineseChippewaChoctawColombianColvilleComancheCosta RicanCreeCreekCroatianCrowCubanCypriotCzechCzechoslovakianDanishDelawareDominicanDutchDutch West IndianEastern EuropeanEcuadorianEgyptianEnglishEstonianEthiopianEuropeanFijianFilipinoFinnishFrenchFrench American IndianFrench CanadianGermanGerman RussianGhanaianGreekGuamanian/ChamorroGuatemalanGuyaneseHaitianHmongHonduranHopiHoumaHungarianIcelanderIndian (Asian)IndonesianInupiatIranianIraqiIrishIroquoisIsraeliItalianJamaicanJapaneseJordanianKenyanKiowaKoreanLaotianLatvianLebaneseLiberianLithuanianLumbeeLuxembourgerMacedonianMalaysianMalteseMarshalleseMenomineeMexicanMexican American IndianMongolianMoroccanNative HawaiianNavajoNepaleseNew ZealanderNicaraguanNigerianNorthern EuropeanNorwegianOkinawanOsageOttawaPaiutePakistaniPalestinianPanamanianParaguayanPennsylvania GermanPeruvianPimaPolishPortuguesePotawatomiPuebloPuerto RicanPuget Sound SalishRomanianRussianSalvadoranSamoanScandinavianScotch-IrishScottishSeminoleSenegaleseSerbianShoshoneSierra LeoneanSiouxSlavicSlovakSloveneSomaliSouth AfricanSouth AmericanSouth American IndianSoviet UnionSpaniardSpanishSpanish AmericanSpanish American IndianSri LankanSubsaharan AfricanSudaneseSwedishSwissSyrianTaiwaneseThaiTlingit-HaidaTohono O'OdhamTonganTrinidadian and TobagonianTsimshianTurkishU.S. Virgin IslanderUgandanUkrainianUruguayanUteVenezuelanVietnameseWelshWest IndianYakamaYaquiYugoslavianYumanYup'ikZimbabwean
Immigration
NonimmigrantsImmigrantsAfghanistanAfricaAlbaniaArgentinaArmeniaAsiaAustraliaAustriaBahamasBangladeshBarbadosBelarusBelgiumBelizeBoliviaBosnia and HerzegovinaBrazilBulgariaBurma/MyanmarCabo VerdeCambodiaCameroonCanadaCaribbeanCentral AmericaChileChinaColombiaCongoCosta RicaCroatiaCubaCzechoslovakiaDenmarkDominicaDominican RepublicEastern AfricaEastern AsiaEastern EuropeEcuadorEgyptEl SalvadorEnglandEritreaEthiopiaEuropeFijiFranceGermanyGhanaGreeceGrenadaGuatemalaGuyanaHaitiHondurasHong KongHungaryIndiaIndonesiaIranIraqIrelandIsraelItalyJamaicaJapanJordanKazakhstanKenyaKoreaKuwaitLaosLatin AmericaLatviaLebanonLiberiaLithuaniaMalaysiaMexicoMicronesiaMiddle AfricaMoldovaMoroccoNepalNetherlandsNicaraguaNigeriaNorth AmericaNorth MacedoniaNorthern AfricaNorthern EuropeNorwayOceaniaPakistanPanamaPeruPhilippinesPolandPortugalRomaniaRussiaSaudi ArabiaScotlandSenegalSerbiaSierra LeoneSingaporeSomaliaSouth AfricaSouth AmericaSouth Central AsiaSouth Eastern AsiaSouthern EuropeSpainSri LankaSt. Vincent and the GrenadinesSudanSwedenSwitzerlandSyriaTaiwanThailandTrinidad and TobagoTurkeyUgandaUkraineUruguayUzbekistanVenezuelaVietnamWest IndiesWestern AfricaWestern AsiaWestern EuropeYemenZaireZimbabweAzores
Master's Degree
Income
Poverty
Unemployment
Labor Participation
Family Structure
Vehicle Availability
Education Level
Disability

Master's Degree Comparison

Arapaho

Immigrants from Iraq

Tragic
Average
10.0%
MASTER'S DEGREE
0.0/ 100
METRIC RATING
334th/ 347
METRIC RANK
14.8%
MASTER'S DEGREE
41.3/ 100
METRIC RATING
179th/ 347
METRIC RANK

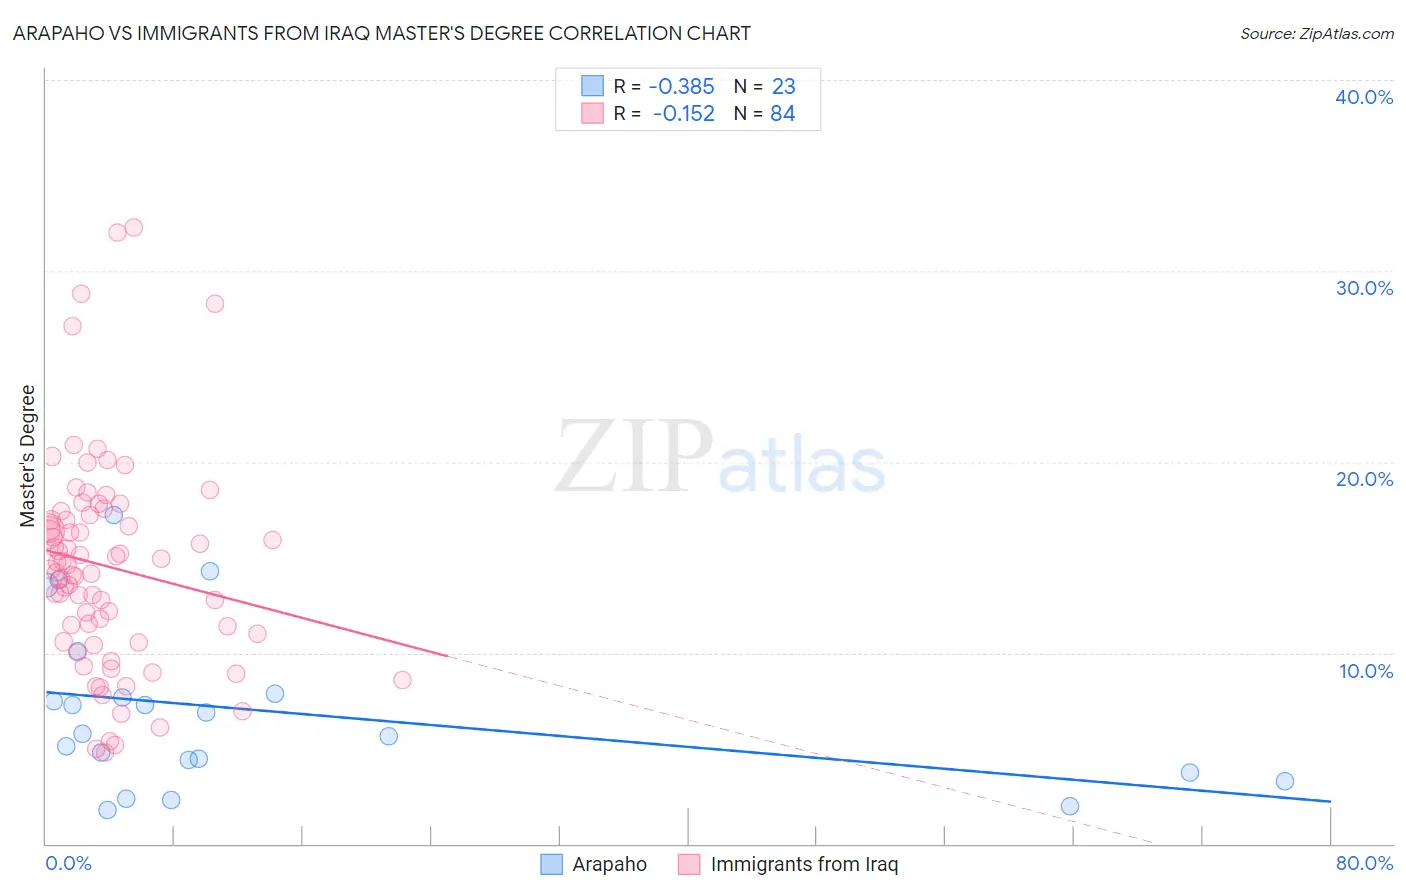
Arapaho vs Immigrants from Iraq Master's Degree Correlation Chart

The statistical analysis conducted on geographies consisting of 29,770,684 people shows a mild negative correlation between the proportion of Arapaho and percentage of population with at least master's degree education in the United States with a correlation coefficient (R) of -0.385 and weighted average of 10.0%. Similarly, the statistical analysis conducted on geographies consisting of 194,768,145 people shows a poor negative correlation between the proportion of Immigrants from Iraq and percentage of population with at least master's degree education in the United States with a correlation coefficient (R) of -0.152 and weighted average of 14.8%, a difference of 47.6%.
Arapaho vs Immigrants from Iraq Master's Degree

Master's Degree Correlation Summary

MeasurementArapahoImmigrants from Iraq
Minimum1.7%4.8%
Maximum17.2%32.3%
Range15.5%27.5%
Mean6.9%14.5%
Median5.7%14.5%
Interquartile 25% (IQ1)3.8%10.8%
Interquartile 75% (IQ3)7.8%17.1%
Interquartile Range (IQR)4.1%6.3%
Standard Deviation (Sample)4.3%5.6%
Standard Deviation (Population)4.2%5.5%

Similar Demographics by Master's Degree

Demographics Similar to Arapaho by Master's Degree

In terms of master's degree, the demographic groups most similar to Arapaho are Immigrants from Central America (10.0%, a difference of 0.13%), Native/Alaskan (9.9%, a difference of 0.64%), Menominee (10.2%, a difference of 1.9%), Immigrants from the Azores (10.2%, a difference of 2.3%), and Pueblo (10.3%, a difference of 2.8%).
DemographicsRating | RankMaster's Degree
Paiute
0.0
/100
|
#327
Tragic
10.5%
Bangladeshis
0.0
/100
|
#328
Tragic
10.5%
Nepalese
0.0
/100
|
#329
Tragic
10.5%
Fijians
0.0
/100
|
#330
Tragic
10.3%
Pueblo
0.0
/100
|
#331
Tragic
10.3%
Immigrants | Azores
0.0
/100
|
#332
Tragic
10.2%
Menominee
0.0
/100
|
#333
Tragic
10.2%
Arapaho
0.0
/100
|
#334
Tragic
10.0%
Immigrants | Central America
0.0
/100
|
#335
Tragic
10.0%
Natives/Alaskans
0.0
/100
|
#336
Tragic
9.9%
Mexicans
0.0
/100
|
#337
Tragic
9.7%
Tohono O'odham
0.0
/100
|
#338
Tragic
9.7%
Spanish American Indians
0.0
/100
|
#339
Tragic
9.6%
Yakama
0.0
/100
|
#340
Tragic
9.5%
Navajo
0.0
/100
|
#341
Tragic
9.4%

Demographics Similar to Immigrants from Iraq by Master's Degree

In terms of master's degree, the demographic groups most similar to Immigrants from Iraq are Celtic (14.8%, a difference of 0.010%), Swiss (14.7%, a difference of 0.030%), Czech (14.7%, a difference of 0.13%), Sri Lankan (14.7%, a difference of 0.23%), and Immigrants from Zaire (14.7%, a difference of 0.25%).
DemographicsRating | RankMaster's Degree
Immigrants | Uruguay
52.8
/100
|
#172
Average
15.0%
Costa Ricans
52.5
/100
|
#173
Average
15.0%
Slovaks
50.0
/100
|
#174
Average
14.9%
Immigrants | Peru
49.6
/100
|
#175
Average
14.9%
Nigerians
48.6
/100
|
#176
Average
14.9%
Immigrants | Colombia
48.3
/100
|
#177
Average
14.9%
English
45.0
/100
|
#178
Average
14.8%
Immigrants | Iraq
41.3
/100
|
#179
Average
14.8%
Celtics
41.3
/100
|
#180
Average
14.8%
Swiss
41.1
/100
|
#181
Average
14.7%
Czechs
40.4
/100
|
#182
Average
14.7%
Sri Lankans
39.6
/100
|
#183
Fair
14.7%
Immigrants | Zaire
39.5
/100
|
#184
Fair
14.7%
Barbadians
38.3
/100
|
#185
Fair
14.7%
Immigrants | Oceania
37.1
/100
|
#186
Fair
14.7%