American vs Immigrants from Venezuela 9th Grade
COMPARE
American
Immigrants from Venezuela
9th Grade
9th Grade Comparison
Americans
Immigrants from Venezuela
95.6%
9TH GRADE
98.5/ 100
METRIC RATING
95th/ 347
METRIC RANK
94.9%
9TH GRADE
46.5/ 100
METRIC RATING
179th/ 347
METRIC RANK
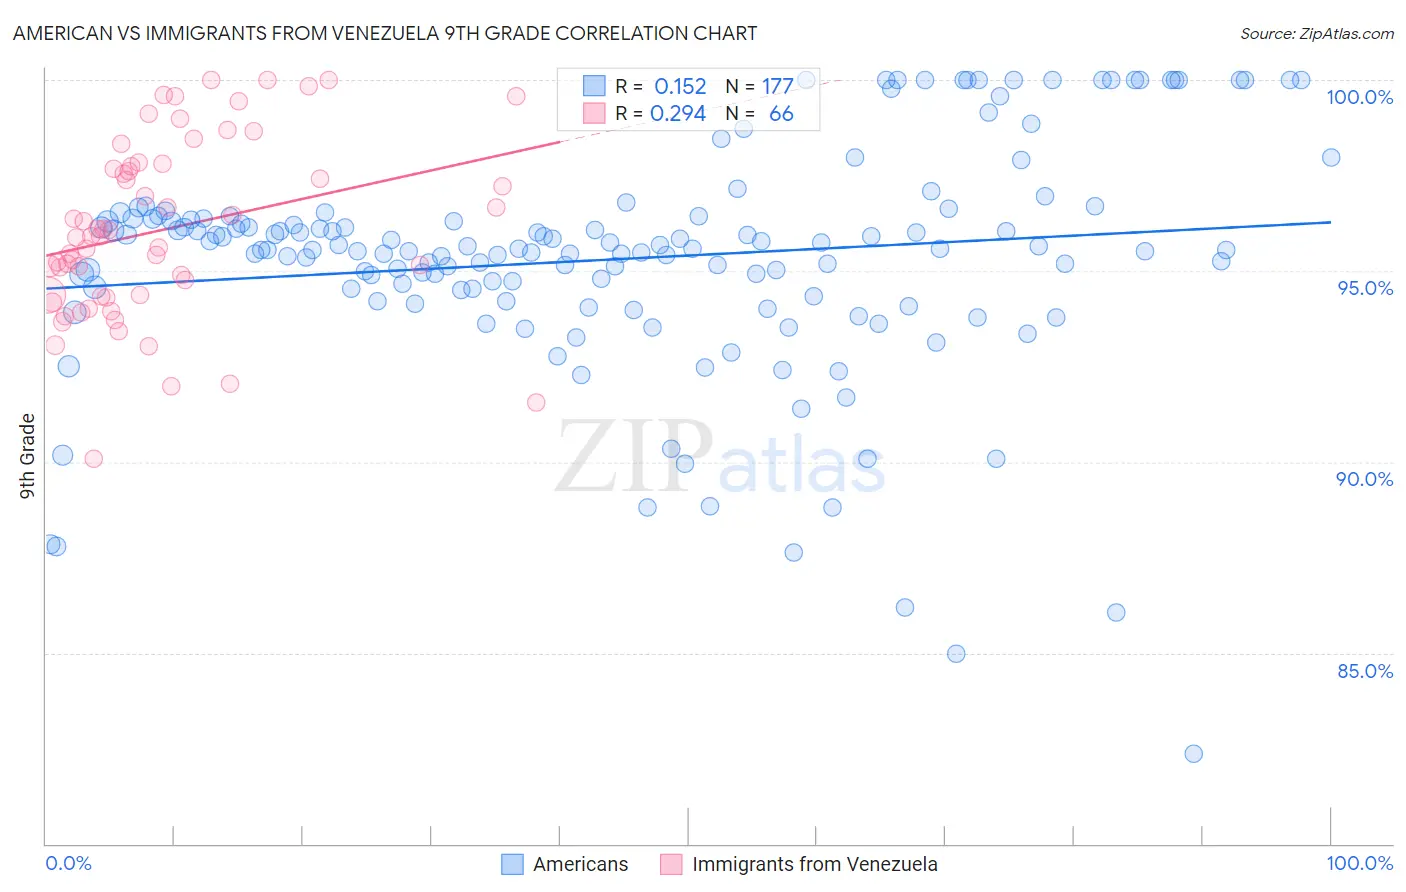
American vs Immigrants from Venezuela 9th Grade Correlation Chart
The statistical analysis conducted on geographies consisting of 581,993,497 people shows a poor positive correlation between the proportion of Americans and percentage of population with at least 9th grade education in the United States with a correlation coefficient (R) of 0.152 and weighted average of 95.6%. Similarly, the statistical analysis conducted on geographies consisting of 287,866,258 people shows a weak positive correlation between the proportion of Immigrants from Venezuela and percentage of population with at least 9th grade education in the United States with a correlation coefficient (R) of 0.294 and weighted average of 94.9%, a difference of 0.80%.
9th Grade Correlation Summary
| Measurement | American | Immigrants from Venezuela |
| Minimum | 82.4% | 90.1% |
| Maximum | 100.0% | 100.0% |
| Range | 17.6% | 9.9% |
| Mean | 95.3% | 96.1% |
| Median | 95.6% | 95.9% |
| Interquartile 25% (IQ1) | 94.4% | 94.4% |
| Interquartile 75% (IQ3) | 96.4% | 97.8% |
| Interquartile Range (IQR) | 2.0% | 3.4% |
| Standard Deviation (Sample) | 3.0% | 2.3% |
| Standard Deviation (Population) | 3.0% | 2.3% |
Similar Demographics by 9th Grade
Demographics Similar to Americans by 9th Grade
In terms of 9th grade, the demographic groups most similar to Americans are Filipino (95.6%, a difference of 0.010%), Delaware (95.6%, a difference of 0.010%), Immigrants from Germany (95.6%, a difference of 0.020%), Immigrants from Latvia (95.6%, a difference of 0.020%), and Immigrants from Japan (95.6%, a difference of 0.020%).
| Demographics | Rating | Rank | 9th Grade |
| Immigrants | Czechoslovakia | 98.9 /100 | #88 | Exceptional 95.7% |
| Yugoslavians | 98.9 /100 | #89 | Exceptional 95.7% |
| South Africans | 98.8 /100 | #90 | Exceptional 95.6% |
| Creek | 98.8 /100 | #91 | Exceptional 95.6% |
| Immigrants | Saudi Arabia | 98.8 /100 | #92 | Exceptional 95.6% |
| Immigrants | Germany | 98.7 /100 | #93 | Exceptional 95.6% |
| Immigrants | Latvia | 98.7 /100 | #94 | Exceptional 95.6% |
| Americans | 98.5 /100 | #95 | Exceptional 95.6% |
| Filipinos | 98.5 /100 | #96 | Exceptional 95.6% |
| Delaware | 98.4 /100 | #97 | Exceptional 95.6% |
| Immigrants | Japan | 98.4 /100 | #98 | Exceptional 95.6% |
| Menominee | 98.3 /100 | #99 | Exceptional 95.6% |
| Lebanese | 98.1 /100 | #100 | Exceptional 95.6% |
| Immigrants | Moldova | 97.9 /100 | #101 | Exceptional 95.5% |
| Immigrants | Switzerland | 97.7 /100 | #102 | Exceptional 95.5% |
Demographics Similar to Immigrants from Venezuela by 9th Grade
In terms of 9th grade, the demographic groups most similar to Immigrants from Venezuela are Immigrants from Poland (94.9%, a difference of 0.0%), Immigrants from Iraq (94.9%, a difference of 0.010%), Brazilian (94.9%, a difference of 0.020%), Immigrants from Spain (94.9%, a difference of 0.020%), and Immigrants from Uganda (94.8%, a difference of 0.020%).
| Demographics | Rating | Rank | 9th Grade |
| Iraqis | 54.0 /100 | #172 | Average 94.9% |
| Cheyenne | 51.5 /100 | #173 | Average 94.9% |
| Immigrants | Egypt | 50.0 /100 | #174 | Average 94.9% |
| Brazilians | 49.8 /100 | #175 | Average 94.9% |
| Immigrants | Spain | 49.1 /100 | #176 | Average 94.9% |
| Immigrants | Iraq | 47.8 /100 | #177 | Average 94.9% |
| Immigrants | Poland | 46.7 /100 | #178 | Average 94.9% |
| Immigrants | Venezuela | 46.5 /100 | #179 | Average 94.9% |
| Immigrants | Uganda | 43.1 /100 | #180 | Average 94.8% |
| Sierra Leoneans | 42.7 /100 | #181 | Average 94.8% |
| Seminole | 42.5 /100 | #182 | Average 94.8% |
| Immigrants | Nepal | 39.7 /100 | #183 | Fair 94.8% |
| Argentineans | 37.6 /100 | #184 | Fair 94.8% |
| Liberians | 37.4 /100 | #185 | Fair 94.8% |
| Hopi | 37.1 /100 | #186 | Fair 94.8% |