Alaskan Athabascan vs Swiss 8th Grade
COMPARE
Alaskan Athabascan
Swiss
8th Grade
8th Grade Comparison
Alaskan Athabascans
Swiss
97.3%
8TH GRADE
100.0/ 100
METRIC RATING
13th/ 347
METRIC RANK
97.0%
8TH GRADE
100.0/ 100
METRIC RATING
33rd/ 347
METRIC RANK
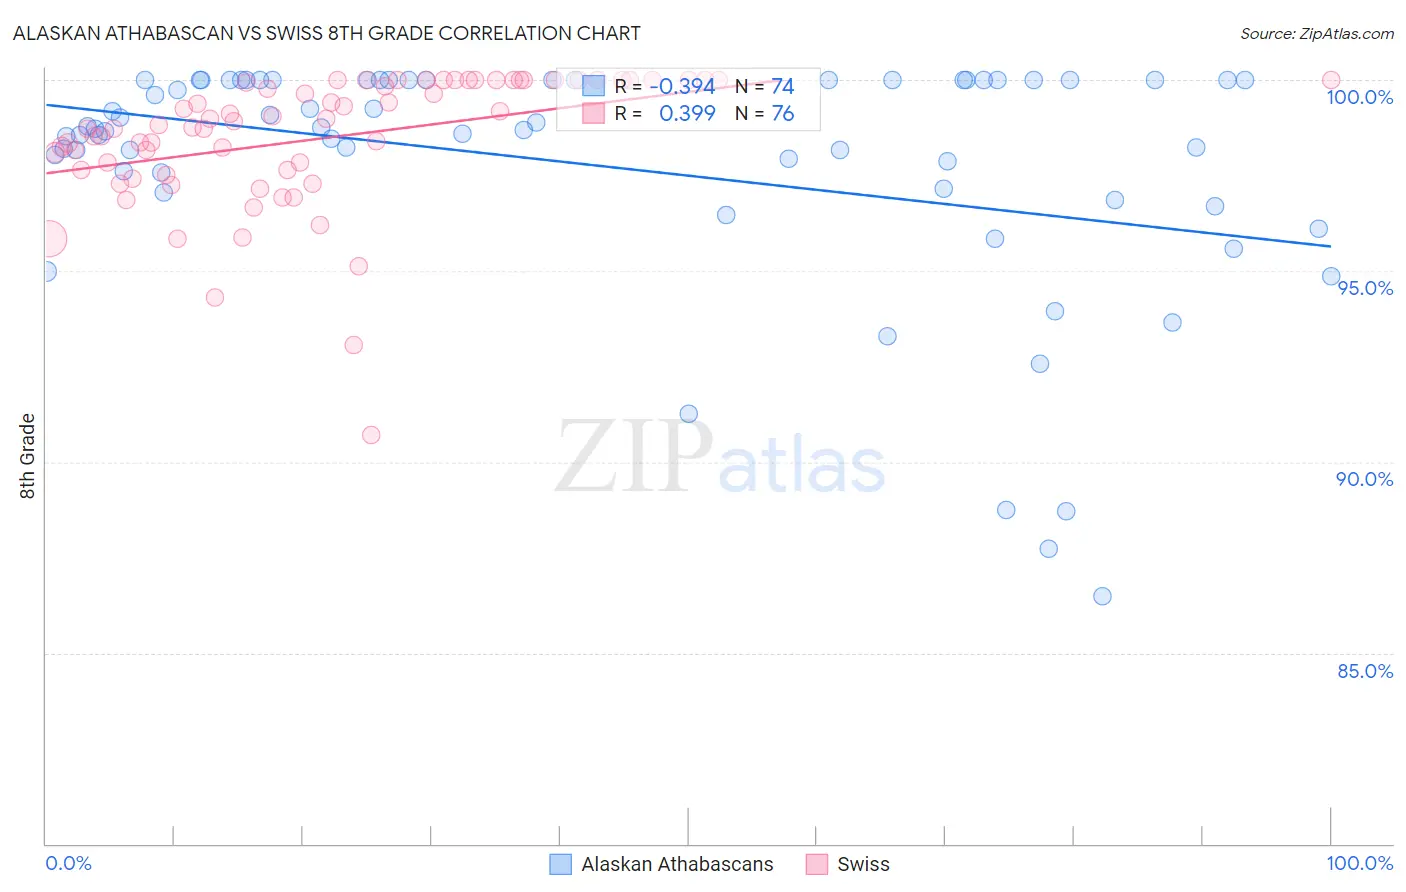
Alaskan Athabascan vs Swiss 8th Grade Correlation Chart
The statistical analysis conducted on geographies consisting of 45,820,365 people shows a mild negative correlation between the proportion of Alaskan Athabascans and percentage of population with at least 8th grade education in the United States with a correlation coefficient (R) of -0.394 and weighted average of 97.3%. Similarly, the statistical analysis conducted on geographies consisting of 465,021,856 people shows a mild positive correlation between the proportion of Swiss and percentage of population with at least 8th grade education in the United States with a correlation coefficient (R) of 0.399 and weighted average of 97.0%, a difference of 0.31%.
8th Grade Correlation Summary
| Measurement | Alaskan Athabascan | Swiss |
| Minimum | 86.5% | 90.7% |
| Maximum | 100.0% | 100.0% |
| Range | 13.5% | 9.3% |
| Mean | 97.8% | 98.5% |
| Median | 98.7% | 98.9% |
| Interquartile 25% (IQ1) | 97.1% | 97.7% |
| Interquartile 75% (IQ3) | 100.0% | 100.0% |
| Interquartile Range (IQR) | 2.9% | 2.3% |
| Standard Deviation (Sample) | 3.1% | 1.8% |
| Standard Deviation (Population) | 3.1% | 1.7% |
Demographics Similar to Alaskan Athabascans and Swiss by 8th Grade
In terms of 8th grade, the demographic groups most similar to Alaskan Athabascans are English (97.3%, a difference of 0.0%), Pennsylvania German (97.3%, a difference of 0.010%), Tlingit-Haida (97.3%, a difference of 0.040%), Irish (97.3%, a difference of 0.050%), and Lithuanian (97.3%, a difference of 0.060%). Similarly, the demographic groups most similar to Swiss are Yup'ik (97.0%, a difference of 0.010%), Sioux (97.1%, a difference of 0.040%), Chippewa (97.1%, a difference of 0.040%), Italian (97.1%, a difference of 0.070%), and European (97.1%, a difference of 0.070%).
| Demographics | Rating | Rank | 8th Grade |
| Alaskan Athabascans | 100.0 /100 | #13 | Exceptional 97.3% |
| English | 100.0 /100 | #14 | Exceptional 97.3% |
| Pennsylvania Germans | 100.0 /100 | #15 | Exceptional 97.3% |
| Tlingit-Haida | 100.0 /100 | #16 | Exceptional 97.3% |
| Irish | 100.0 /100 | #17 | Exceptional 97.3% |
| Lithuanians | 100.0 /100 | #18 | Exceptional 97.3% |
| Scottish | 100.0 /100 | #19 | Exceptional 97.3% |
| Croatians | 100.0 /100 | #20 | Exceptional 97.2% |
| Danes | 100.0 /100 | #21 | Exceptional 97.2% |
| Welsh | 100.0 /100 | #22 | Exceptional 97.2% |
| French Canadians | 100.0 /100 | #23 | Exceptional 97.2% |
| Scandinavians | 100.0 /100 | #24 | Exceptional 97.2% |
| Czechs | 100.0 /100 | #25 | Exceptional 97.1% |
| French | 100.0 /100 | #26 | Exceptional 97.1% |
| Scotch-Irish | 100.0 /100 | #27 | Exceptional 97.1% |
| Italians | 100.0 /100 | #28 | Exceptional 97.1% |
| Europeans | 100.0 /100 | #29 | Exceptional 97.1% |
| Sioux | 100.0 /100 | #30 | Exceptional 97.1% |
| Chippewa | 100.0 /100 | #31 | Exceptional 97.1% |
| Yup'ik | 100.0 /100 | #32 | Exceptional 97.0% |
| Swiss | 100.0 /100 | #33 | Exceptional 97.0% |