Alaska Native vs Immigrants from Somalia 3rd Grade
COMPARE
Alaska Native
Immigrants from Somalia
3rd Grade
3rd Grade Comparison
Alaska Natives
Immigrants from Somalia
98.6%
3RD GRADE
100.0/ 100
METRIC RATING
10th/ 347
METRIC RANK
96.8%
3RD GRADE
0.0/ 100
METRIC RATING
302nd/ 347
METRIC RANK
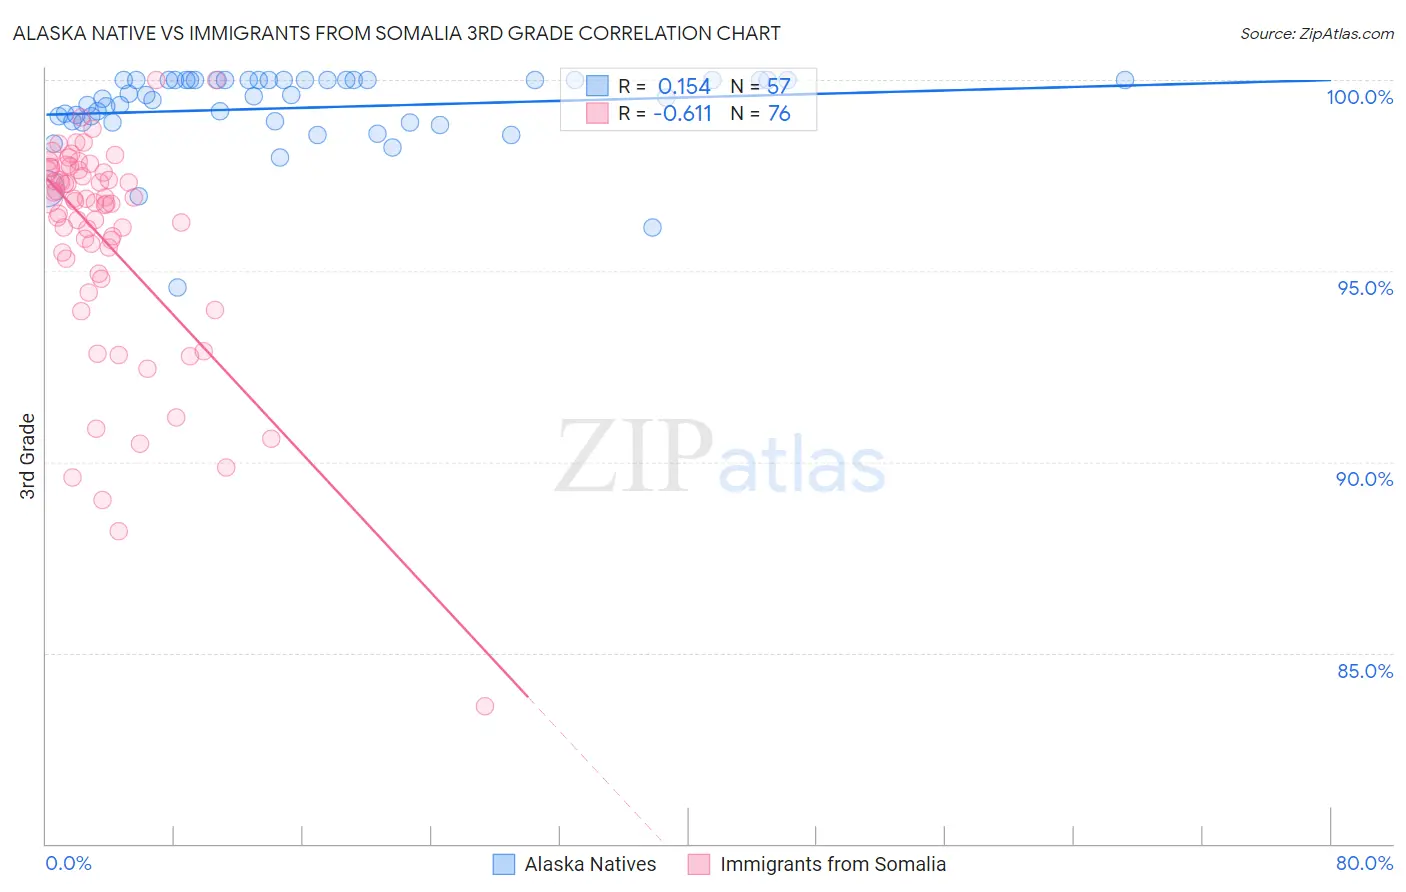
Alaska Native vs Immigrants from Somalia 3rd Grade Correlation Chart
The statistical analysis conducted on geographies consisting of 76,775,774 people shows a poor positive correlation between the proportion of Alaska Natives and percentage of population with at least 3rd grade education in the United States with a correlation coefficient (R) of 0.154 and weighted average of 98.6%. Similarly, the statistical analysis conducted on geographies consisting of 92,111,755 people shows a significant negative correlation between the proportion of Immigrants from Somalia and percentage of population with at least 3rd grade education in the United States with a correlation coefficient (R) of -0.611 and weighted average of 96.8%, a difference of 1.9%.
3rd Grade Correlation Summary
| Measurement | Alaska Native | Immigrants from Somalia |
| Minimum | 94.6% | 83.6% |
| Maximum | 100.0% | 100.0% |
| Range | 5.4% | 16.4% |
| Mean | 99.3% | 95.8% |
| Median | 99.6% | 96.8% |
| Interquartile 25% (IQ1) | 98.9% | 95.1% |
| Interquartile 75% (IQ3) | 100.0% | 97.6% |
| Interquartile Range (IQR) | 1.1% | 2.5% |
| Standard Deviation (Sample) | 1.0% | 3.0% |
| Standard Deviation (Population) | 1.0% | 2.9% |
Similar Demographics by 3rd Grade
Demographics Similar to Alaska Natives by 3rd Grade
In terms of 3rd grade, the demographic groups most similar to Alaska Natives are Slovene (98.6%, a difference of 0.0%), English (98.6%, a difference of 0.020%), Tlingit-Haida (98.5%, a difference of 0.020%), Slovak (98.6%, a difference of 0.030%), and German (98.6%, a difference of 0.030%).
| Demographics | Rating | Rank | 3rd Grade |
| Welsh | 100.0 /100 | #3 | Exceptional 98.8% |
| Inupiat | 100.0 /100 | #4 | Exceptional 98.8% |
| Tsimshian | 100.0 /100 | #5 | Exceptional 98.8% |
| Alaskan Athabascans | 100.0 /100 | #6 | Exceptional 98.7% |
| Norwegians | 100.0 /100 | #7 | Exceptional 98.6% |
| Slovaks | 100.0 /100 | #8 | Exceptional 98.6% |
| Germans | 100.0 /100 | #9 | Exceptional 98.6% |
| Alaska Natives | 100.0 /100 | #10 | Exceptional 98.6% |
| Slovenes | 100.0 /100 | #11 | Exceptional 98.6% |
| English | 100.0 /100 | #12 | Exceptional 98.6% |
| Tlingit-Haida | 100.0 /100 | #13 | Exceptional 98.5% |
| Carpatho Rusyns | 100.0 /100 | #14 | Exceptional 98.5% |
| Swedes | 100.0 /100 | #15 | Exceptional 98.5% |
| Scottish | 100.0 /100 | #16 | Exceptional 98.5% |
| Dutch | 100.0 /100 | #17 | Exceptional 98.5% |
Demographics Similar to Immigrants from Somalia by 3rd Grade
In terms of 3rd grade, the demographic groups most similar to Immigrants from Somalia are Ecuadorian (96.7%, a difference of 0.010%), Immigrants from Caribbean (96.7%, a difference of 0.020%), Central American Indian (96.7%, a difference of 0.030%), Guyanese (96.7%, a difference of 0.060%), and Immigrants from Cuba (96.8%, a difference of 0.070%).
| Demographics | Rating | Rank | 3rd Grade |
| Immigrants | Eritrea | 0.0 /100 | #295 | Tragic 97.0% |
| Immigrants | Immigrants | 0.0 /100 | #296 | Tragic 96.9% |
| Haitians | 0.0 /100 | #297 | Tragic 96.9% |
| Immigrants | Dominica | 0.0 /100 | #298 | Tragic 96.9% |
| Somalis | 0.0 /100 | #299 | Tragic 96.8% |
| Immigrants | South Eastern Asia | 0.0 /100 | #300 | Tragic 96.8% |
| Immigrants | Cuba | 0.0 /100 | #301 | Tragic 96.8% |
| Immigrants | Somalia | 0.0 /100 | #302 | Tragic 96.8% |
| Ecuadorians | 0.0 /100 | #303 | Tragic 96.7% |
| Immigrants | Caribbean | 0.0 /100 | #304 | Tragic 96.7% |
| Central American Indians | 0.0 /100 | #305 | Tragic 96.7% |
| Guyanese | 0.0 /100 | #306 | Tragic 96.7% |
| Nicaraguans | 0.0 /100 | #307 | Tragic 96.7% |
| Immigrants | Haiti | 0.0 /100 | #308 | Tragic 96.7% |
| Sri Lankans | 0.0 /100 | #309 | Tragic 96.7% |