African vs Immigrants from Argentina Professional Degree
COMPARE
African
Immigrants from Argentina
Professional Degree
Professional Degree Comparison
Africans
Immigrants from Argentina
3.7%
PROFESSIONAL DEGREE
1.0/ 100
METRIC RATING
259th/ 347
METRIC RANK
5.9%
PROFESSIONAL DEGREE
100.0/ 100
METRIC RATING
46th/ 347
METRIC RANK
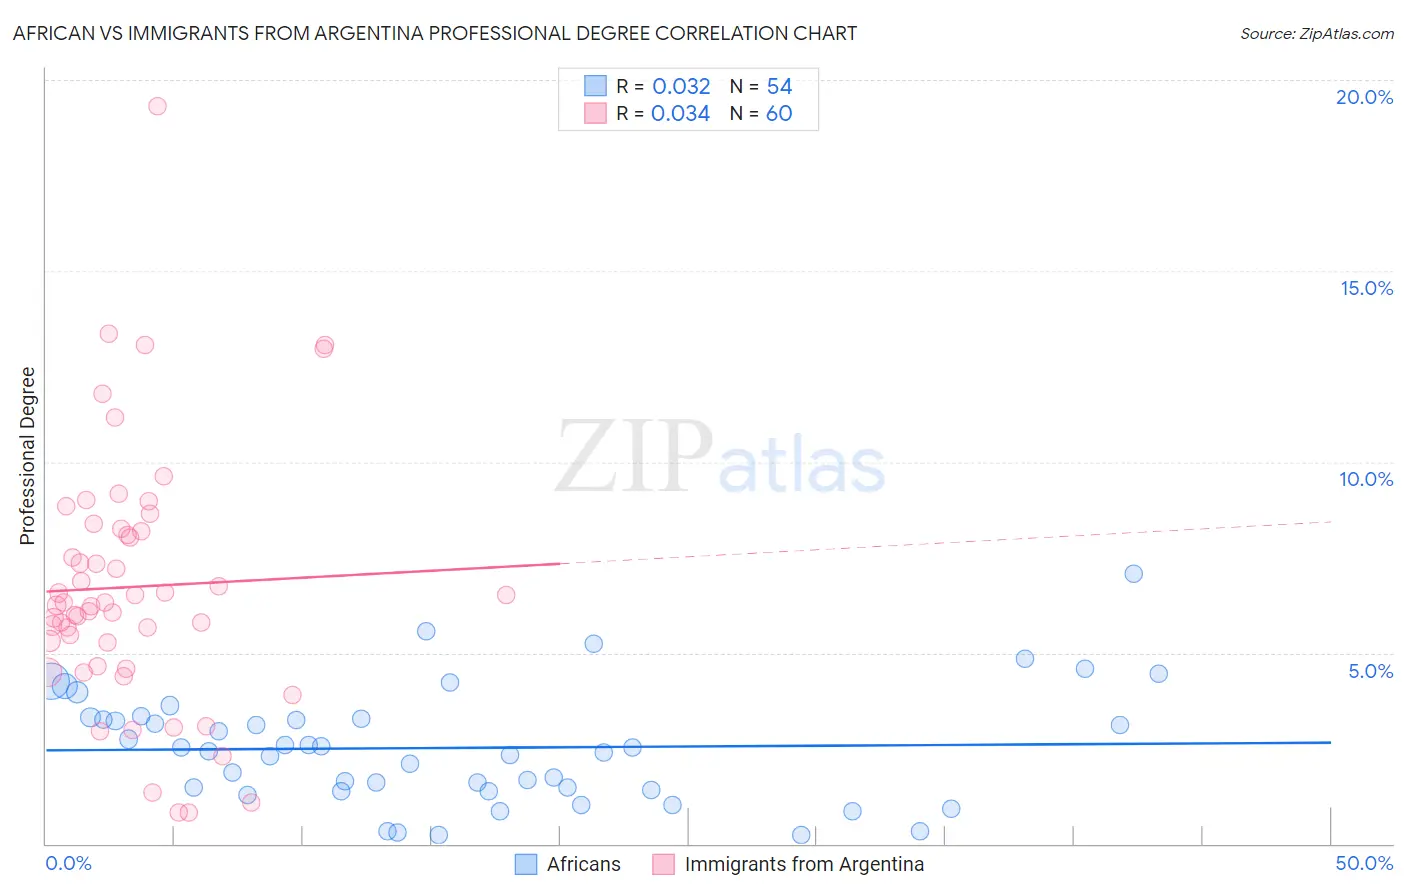
African vs Immigrants from Argentina Professional Degree Correlation Chart
The statistical analysis conducted on geographies consisting of 467,688,066 people shows no correlation between the proportion of Africans and percentage of population with at least professional degree education in the United States with a correlation coefficient (R) of 0.032 and weighted average of 3.7%. Similarly, the statistical analysis conducted on geographies consisting of 264,255,384 people shows no correlation between the proportion of Immigrants from Argentina and percentage of population with at least professional degree education in the United States with a correlation coefficient (R) of 0.034 and weighted average of 5.9%, a difference of 60.4%.
Professional Degree Correlation Summary
| Measurement | African | Immigrants from Argentina |
| Minimum | 0.23% | 0.81% |
| Maximum | 7.1% | 19.3% |
| Range | 6.8% | 18.5% |
| Mean | 2.5% | 6.7% |
| Median | 2.5% | 6.3% |
| Interquartile 25% (IQ1) | 1.4% | 5.0% |
| Interquartile 75% (IQ3) | 3.3% | 8.2% |
| Interquartile Range (IQR) | 1.9% | 3.2% |
| Standard Deviation (Sample) | 1.5% | 3.4% |
| Standard Deviation (Population) | 1.5% | 3.3% |
Similar Demographics by Professional Degree
Demographics Similar to Africans by Professional Degree
In terms of professional degree, the demographic groups most similar to Africans are Indonesian (3.7%, a difference of 0.010%), Immigrants from Guyana (3.7%, a difference of 0.19%), U.S. Virgin Islander (3.7%, a difference of 0.20%), Immigrants from St. Vincent and the Grenadines (3.7%, a difference of 0.22%), and Bahamian (3.7%, a difference of 0.30%).
| Demographics | Rating | Rank | Professional Degree |
| Jamaicans | 1.4 /100 | #252 | Tragic 3.7% |
| Pueblo | 1.4 /100 | #253 | Tragic 3.7% |
| Tongans | 1.3 /100 | #254 | Tragic 3.7% |
| Osage | 1.2 /100 | #255 | Tragic 3.7% |
| Iroquois | 1.2 /100 | #256 | Tragic 3.7% |
| Bahamians | 1.1 /100 | #257 | Tragic 3.7% |
| Immigrants | St. Vincent and the Grenadines | 1.1 /100 | #258 | Tragic 3.7% |
| Africans | 1.0 /100 | #259 | Tragic 3.7% |
| Indonesians | 1.0 /100 | #260 | Tragic 3.7% |
| Immigrants | Guyana | 1.0 /100 | #261 | Tragic 3.7% |
| U.S. Virgin Islanders | 1.0 /100 | #262 | Tragic 3.7% |
| Hopi | 0.9 /100 | #263 | Tragic 3.6% |
| Immigrants | Cambodia | 0.9 /100 | #264 | Tragic 3.6% |
| Immigrants | Congo | 0.8 /100 | #265 | Tragic 3.6% |
| Central American Indians | 0.8 /100 | #266 | Tragic 3.6% |
Demographics Similar to Immigrants from Argentina by Professional Degree
In terms of professional degree, the demographic groups most similar to Immigrants from Argentina are Australian (5.9%, a difference of 0.010%), Immigrants from South Central Asia (5.9%, a difference of 0.21%), Paraguayan (5.9%, a difference of 0.43%), Argentinean (5.9%, a difference of 0.65%), and Immigrants from Saudi Arabia (5.9%, a difference of 0.81%).
| Demographics | Rating | Rank | Professional Degree |
| Immigrants | South Africa | 100.0 /100 | #39 | Exceptional 6.0% |
| Cambodians | 100.0 /100 | #40 | Exceptional 6.0% |
| New Zealanders | 100.0 /100 | #41 | Exceptional 6.0% |
| Estonians | 100.0 /100 | #42 | Exceptional 6.0% |
| Immigrants | Saudi Arabia | 100.0 /100 | #43 | Exceptional 5.9% |
| Argentineans | 100.0 /100 | #44 | Exceptional 5.9% |
| Immigrants | South Central Asia | 100.0 /100 | #45 | Exceptional 5.9% |
| Immigrants | Argentina | 100.0 /100 | #46 | Exceptional 5.9% |
| Australians | 100.0 /100 | #47 | Exceptional 5.9% |
| Paraguayans | 100.0 /100 | #48 | Exceptional 5.9% |
| Immigrants | Latvia | 100.0 /100 | #49 | Exceptional 5.8% |
| Immigrants | Czechoslovakia | 100.0 /100 | #50 | Exceptional 5.8% |
| Immigrants | Greece | 100.0 /100 | #51 | Exceptional 5.8% |
| Immigrants | Serbia | 100.0 /100 | #52 | Exceptional 5.8% |
| Immigrants | Netherlands | 100.0 /100 | #53 | Exceptional 5.8% |