Afghan vs Immigrants from Greece 7th Grade
COMPARE
Afghan
Immigrants from Greece
7th Grade
7th Grade Comparison
Afghans
Immigrants from Greece
95.3%
7TH GRADE
0.5/ 100
METRIC RATING
260th/ 347
METRIC RANK
96.3%
7TH GRADE
85.9/ 100
METRIC RATING
144th/ 347
METRIC RANK
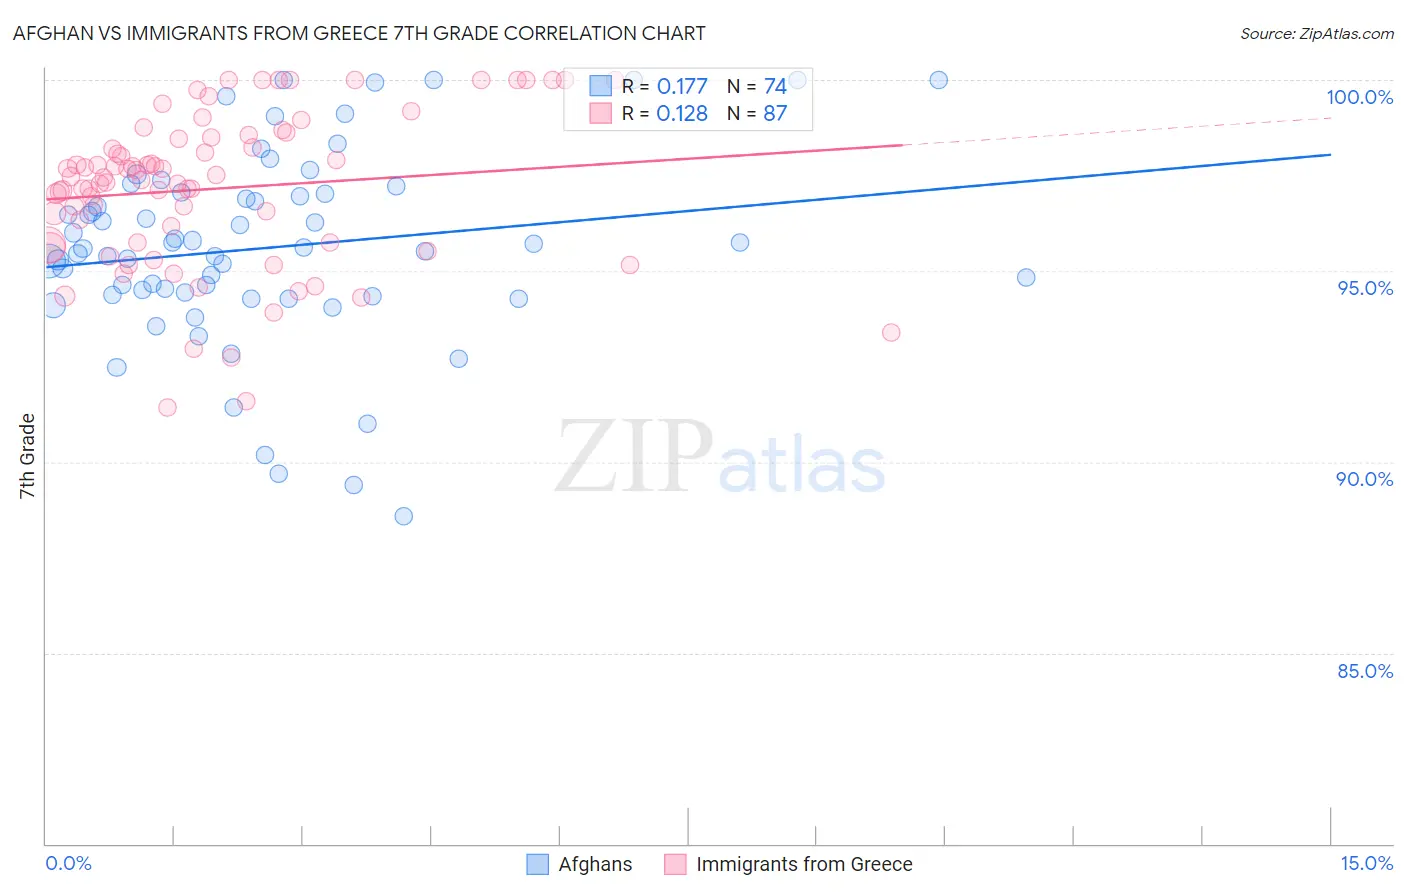
Afghan vs Immigrants from Greece 7th Grade Correlation Chart
The statistical analysis conducted on geographies consisting of 148,851,685 people shows a poor positive correlation between the proportion of Afghans and percentage of population with at least 7th grade education in the United States with a correlation coefficient (R) of 0.177 and weighted average of 95.3%. Similarly, the statistical analysis conducted on geographies consisting of 216,879,847 people shows a poor positive correlation between the proportion of Immigrants from Greece and percentage of population with at least 7th grade education in the United States with a correlation coefficient (R) of 0.128 and weighted average of 96.3%, a difference of 1.1%.
7th Grade Correlation Summary
| Measurement | Afghan | Immigrants from Greece |
| Minimum | 88.6% | 91.4% |
| Maximum | 100.0% | 100.0% |
| Range | 11.4% | 8.6% |
| Mean | 95.6% | 97.2% |
| Median | 95.6% | 97.4% |
| Interquartile 25% (IQ1) | 94.4% | 95.7% |
| Interquartile 75% (IQ3) | 97.0% | 98.5% |
| Interquartile Range (IQR) | 2.7% | 2.8% |
| Standard Deviation (Sample) | 2.5% | 2.0% |
| Standard Deviation (Population) | 2.5% | 2.0% |
Similar Demographics by 7th Grade
Demographics Similar to Afghans by 7th Grade
In terms of 7th grade, the demographic groups most similar to Afghans are South American (95.2%, a difference of 0.010%), Immigrants from Somalia (95.2%, a difference of 0.010%), West Indian (95.2%, a difference of 0.010%), Immigrants from Nigeria (95.2%, a difference of 0.020%), and Immigrants from Costa Rica (95.3%, a difference of 0.030%).
| Demographics | Rating | Rank | 7th Grade |
| Somalis | 0.9 /100 | #253 | Tragic 95.3% |
| Colombians | 0.8 /100 | #254 | Tragic 95.3% |
| Koreans | 0.8 /100 | #255 | Tragic 95.3% |
| Immigrants | China | 0.7 /100 | #256 | Tragic 95.3% |
| Immigrants | Congo | 0.7 /100 | #257 | Tragic 95.3% |
| Ghanaians | 0.7 /100 | #258 | Tragic 95.3% |
| Immigrants | Costa Rica | 0.6 /100 | #259 | Tragic 95.3% |
| Afghans | 0.5 /100 | #260 | Tragic 95.3% |
| South Americans | 0.5 /100 | #261 | Tragic 95.2% |
| Immigrants | Somalia | 0.5 /100 | #262 | Tragic 95.2% |
| West Indians | 0.5 /100 | #263 | Tragic 95.2% |
| Immigrants | Nigeria | 0.4 /100 | #264 | Tragic 95.2% |
| Immigrants | Uruguay | 0.3 /100 | #265 | Tragic 95.2% |
| Immigrants | Ghana | 0.3 /100 | #266 | Tragic 95.2% |
| Yuman | 0.3 /100 | #267 | Tragic 95.2% |
Demographics Similar to Immigrants from Greece by 7th Grade
In terms of 7th grade, the demographic groups most similar to Immigrants from Greece are Spanish (96.3%, a difference of 0.010%), Immigrants from South Central Asia (96.3%, a difference of 0.020%), Burmese (96.3%, a difference of 0.020%), Blackfeet (96.3%, a difference of 0.020%), and Cambodian (96.3%, a difference of 0.030%).
| Demographics | Rating | Rank | 7th Grade |
| Immigrants | Turkey | 90.2 /100 | #137 | Exceptional 96.4% |
| Jordanians | 90.0 /100 | #138 | Excellent 96.4% |
| Basques | 89.3 /100 | #139 | Excellent 96.4% |
| Cambodians | 88.3 /100 | #140 | Excellent 96.3% |
| Immigrants | South Central Asia | 87.1 /100 | #141 | Excellent 96.3% |
| Burmese | 87.1 /100 | #142 | Excellent 96.3% |
| Spanish | 86.6 /100 | #143 | Excellent 96.3% |
| Immigrants | Greece | 85.9 /100 | #144 | Excellent 96.3% |
| Blackfeet | 83.9 /100 | #145 | Excellent 96.3% |
| Immigrants | Eastern Europe | 83.7 /100 | #146 | Excellent 96.3% |
| French American Indians | 83.1 /100 | #147 | Excellent 96.3% |
| Israelis | 82.8 /100 | #148 | Excellent 96.3% |
| Albanians | 82.6 /100 | #149 | Excellent 96.3% |
| Immigrants | Belarus | 82.4 /100 | #150 | Excellent 96.3% |
| Hopi | 81.6 /100 | #151 | Excellent 96.3% |