Welsh vs Immigrants from Portugal Disability Age 35 to 64
COMPARE
Welsh
Immigrants from Portugal
Disability Age 35 to 64
Disability Age 35 to 64 Comparison
Welsh
Immigrants from Portugal
12.4%
DISABILITY AGE 35 TO 64
0.6/ 100
METRIC RATING
258th/ 347
METRIC RANK
12.5%
DISABILITY AGE 35 TO 64
0.4/ 100
METRIC RATING
264th/ 347
METRIC RANK
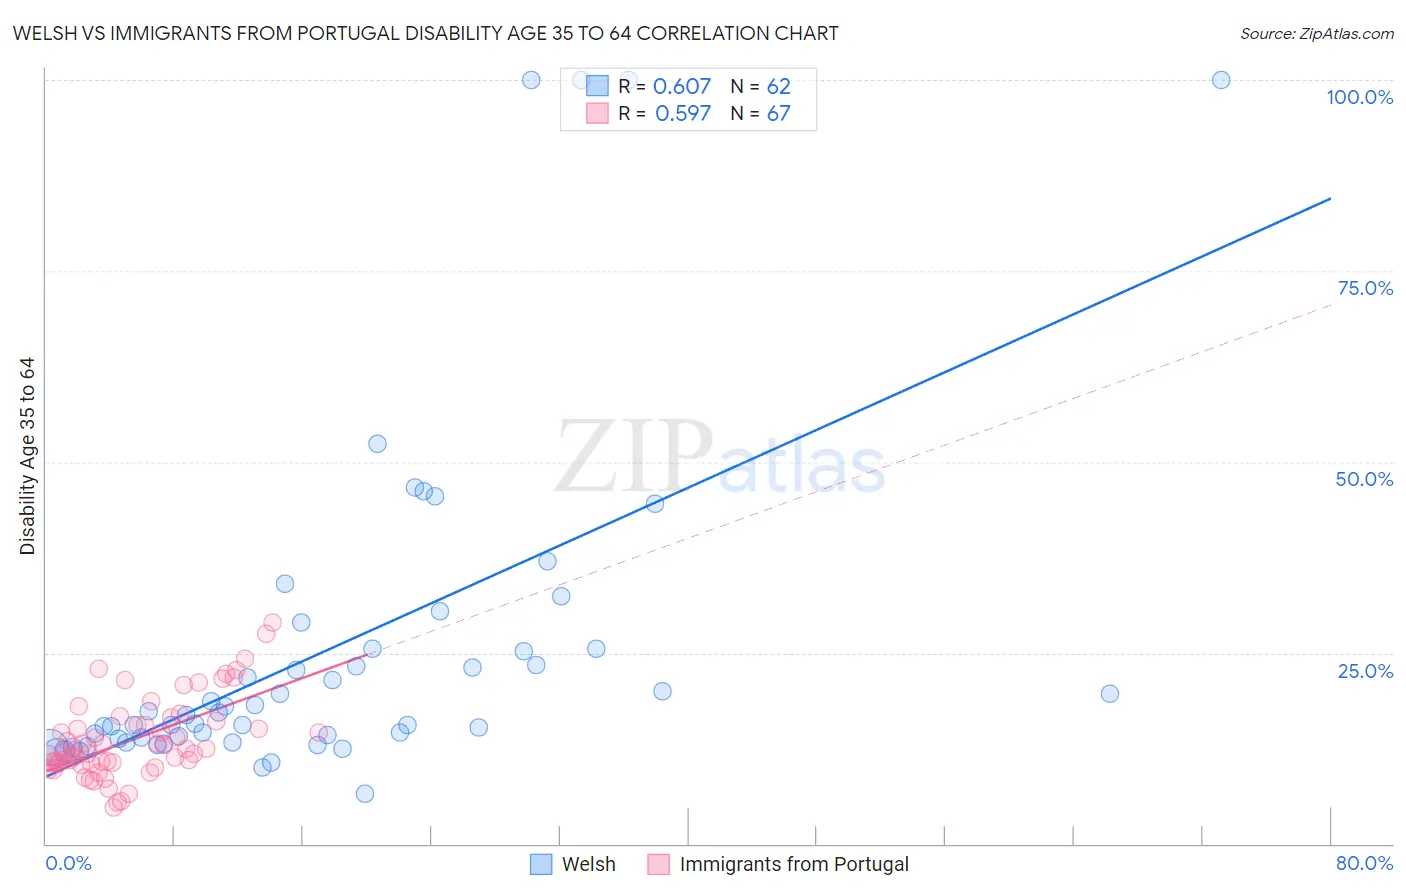
Welsh vs Immigrants from Portugal Disability Age 35 to 64 Correlation Chart
The statistical analysis conducted on geographies consisting of 527,956,367 people shows a significant positive correlation between the proportion of Welsh and percentage of population with a disability between the ages 34 and 64 in the United States with a correlation coefficient (R) of 0.607 and weighted average of 12.4%. Similarly, the statistical analysis conducted on geographies consisting of 174,765,527 people shows a substantial positive correlation between the proportion of Immigrants from Portugal and percentage of population with a disability between the ages 34 and 64 in the United States with a correlation coefficient (R) of 0.597 and weighted average of 12.5%, a difference of 0.87%.
Disability Age 35 to 64 Correlation Summary
| Measurement | Welsh | Immigrants from Portugal |
| Minimum | 6.5% | 4.8% |
| Maximum | 100.0% | 28.9% |
| Range | 93.5% | 24.1% |
| Mean | 25.5% | 13.6% |
| Median | 17.0% | 12.2% |
| Interquartile 25% (IQ1) | 13.8% | 10.6% |
| Interquartile 75% (IQ3) | 25.5% | 16.0% |
| Interquartile Range (IQR) | 11.7% | 5.5% |
| Standard Deviation (Sample) | 22.1% | 5.2% |
| Standard Deviation (Population) | 21.9% | 5.2% |
Demographics Similar to Welsh and Immigrants from Portugal by Disability Age 35 to 64
In terms of disability age 35 to 64, the demographic groups most similar to Welsh are Mexican (12.4%, a difference of 0.080%), English (12.4%, a difference of 0.12%), Scottish (12.4%, a difference of 0.34%), German Russian (12.5%, a difference of 0.37%), and Japanese (12.3%, a difference of 0.51%). Similarly, the demographic groups most similar to Immigrants from Portugal are Immigrants from Zaire (12.5%, a difference of 0.010%), Marshallese (12.5%, a difference of 0.11%), Senegalese (12.5%, a difference of 0.26%), Malaysian (12.5%, a difference of 0.34%), and German Russian (12.5%, a difference of 0.49%).
| Demographics | Rating | Rank | Disability Age 35 to 64 |
| Germans | 1.1 /100 | #251 | Tragic 12.3% |
| Irish | 1.0 /100 | #252 | Tragic 12.3% |
| Dutch | 1.0 /100 | #253 | Tragic 12.3% |
| Hawaiians | 0.9 /100 | #254 | Tragic 12.3% |
| Japanese | 0.8 /100 | #255 | Tragic 12.3% |
| Scottish | 0.8 /100 | #256 | Tragic 12.4% |
| Mexicans | 0.7 /100 | #257 | Tragic 12.4% |
| Welsh | 0.6 /100 | #258 | Tragic 12.4% |
| English | 0.6 /100 | #259 | Tragic 12.4% |
| German Russians | 0.5 /100 | #260 | Tragic 12.5% |
| Malaysians | 0.5 /100 | #261 | Tragic 12.5% |
| Senegalese | 0.5 /100 | #262 | Tragic 12.5% |
| Immigrants | Zaire | 0.4 /100 | #263 | Tragic 12.5% |
| Immigrants | Portugal | 0.4 /100 | #264 | Tragic 12.5% |
| Marshallese | 0.4 /100 | #265 | Tragic 12.5% |
| Whites/Caucasians | 0.3 /100 | #266 | Tragic 12.6% |
| Sub-Saharan Africans | 0.2 /100 | #267 | Tragic 12.6% |
| Immigrants | Dominica | 0.2 /100 | #268 | Tragic 12.7% |
| Spanish | 0.2 /100 | #269 | Tragic 12.7% |
| French | 0.2 /100 | #270 | Tragic 12.7% |
| Nepalese | 0.1 /100 | #271 | Tragic 12.8% |