Spanish American vs Immigrants from Nepal Disability Age 35 to 64
COMPARE
Spanish American
Immigrants from Nepal
Disability Age 35 to 64
Disability Age 35 to 64 Comparison
Spanish Americans
Immigrants from Nepal
13.7%
DISABILITY AGE 35 TO 64
0.0/ 100
METRIC RATING
299th/ 347
METRIC RANK
10.6%
DISABILITY AGE 35 TO 64
95.9/ 100
METRIC RATING
116th/ 347
METRIC RANK
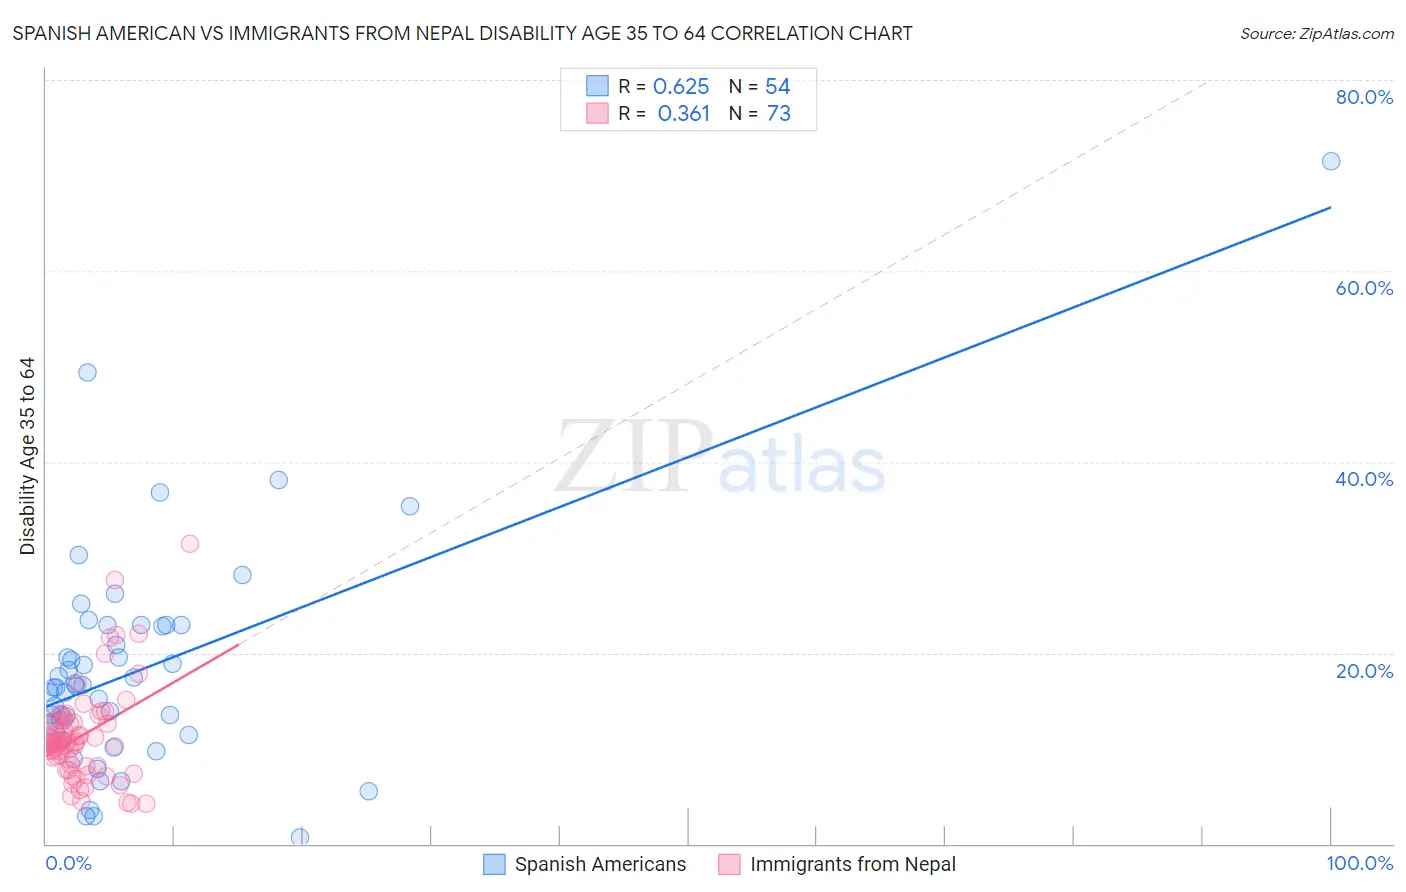
Spanish American vs Immigrants from Nepal Disability Age 35 to 64 Correlation Chart
The statistical analysis conducted on geographies consisting of 103,165,230 people shows a significant positive correlation between the proportion of Spanish Americans and percentage of population with a disability between the ages 34 and 64 in the United States with a correlation coefficient (R) of 0.625 and weighted average of 13.7%. Similarly, the statistical analysis conducted on geographies consisting of 186,686,012 people shows a mild positive correlation between the proportion of Immigrants from Nepal and percentage of population with a disability between the ages 34 and 64 in the United States with a correlation coefficient (R) of 0.361 and weighted average of 10.6%, a difference of 29.4%.
Disability Age 35 to 64 Correlation Summary
| Measurement | Spanish American | Immigrants from Nepal |
| Minimum | 0.65% | 4.2% |
| Maximum | 71.5% | 31.4% |
| Range | 70.8% | 27.2% |
| Mean | 18.2% | 11.3% |
| Median | 16.4% | 10.6% |
| Interquartile 25% (IQ1) | 11.5% | 8.2% |
| Interquartile 75% (IQ3) | 22.9% | 12.9% |
| Interquartile Range (IQR) | 11.3% | 4.6% |
| Standard Deviation (Sample) | 11.9% | 4.9% |
| Standard Deviation (Population) | 11.8% | 4.9% |
Similar Demographics by Disability Age 35 to 64
Demographics Similar to Spanish Americans by Disability Age 35 to 64
In terms of disability age 35 to 64, the demographic groups most similar to Spanish Americans are Delaware (13.7%, a difference of 0.080%), Cheyenne (13.6%, a difference of 0.20%), Bangladeshi (13.6%, a difference of 0.23%), French American Indian (13.7%, a difference of 0.38%), and African (13.6%, a difference of 0.58%).
| Demographics | Rating | Rank | Disability Age 35 to 64 |
| Puget Sound Salish | 0.0 /100 | #292 | Tragic 13.3% |
| Ute | 0.0 /100 | #293 | Tragic 13.4% |
| Yaqui | 0.0 /100 | #294 | Tragic 13.5% |
| Yakama | 0.0 /100 | #295 | Tragic 13.6% |
| Africans | 0.0 /100 | #296 | Tragic 13.6% |
| Bangladeshis | 0.0 /100 | #297 | Tragic 13.6% |
| Cheyenne | 0.0 /100 | #298 | Tragic 13.6% |
| Spanish Americans | 0.0 /100 | #299 | Tragic 13.7% |
| Delaware | 0.0 /100 | #300 | Tragic 13.7% |
| French American Indians | 0.0 /100 | #301 | Tragic 13.7% |
| Aleuts | 0.0 /100 | #302 | Tragic 13.8% |
| Sioux | 0.0 /100 | #303 | Tragic 13.9% |
| Hopi | 0.0 /100 | #304 | Tragic 13.9% |
| Americans | 0.0 /100 | #305 | Tragic 13.9% |
| Immigrants | Yemen | 0.0 /100 | #306 | Tragic 14.0% |
Demographics Similar to Immigrants from Nepal by Disability Age 35 to 64
In terms of disability age 35 to 64, the demographic groups most similar to Immigrants from Nepal are Immigrants from South Eastern Asia (10.6%, a difference of 0.10%), Immigrants from Moldova (10.6%, a difference of 0.19%), Immigrants from Netherlands (10.5%, a difference of 0.23%), Luxembourger (10.6%, a difference of 0.23%), and Vietnamese (10.6%, a difference of 0.26%).
| Demographics | Rating | Rank | Disability Age 35 to 64 |
| Immigrants | Ethiopia | 97.2 /100 | #109 | Exceptional 10.5% |
| Koreans | 97.1 /100 | #110 | Exceptional 10.5% |
| Brazilians | 96.9 /100 | #111 | Exceptional 10.5% |
| Assyrians/Chaldeans/Syriacs | 96.8 /100 | #112 | Exceptional 10.5% |
| Tongans | 96.6 /100 | #113 | Exceptional 10.5% |
| Immigrants | Morocco | 96.6 /100 | #114 | Exceptional 10.5% |
| Immigrants | Netherlands | 96.3 /100 | #115 | Exceptional 10.5% |
| Immigrants | Nepal | 95.9 /100 | #116 | Exceptional 10.6% |
| Immigrants | South Eastern Asia | 95.7 /100 | #117 | Exceptional 10.6% |
| Immigrants | Moldova | 95.5 /100 | #118 | Exceptional 10.6% |
| Luxembourgers | 95.5 /100 | #119 | Exceptional 10.6% |
| Vietnamese | 95.4 /100 | #120 | Exceptional 10.6% |
| Romanians | 95.0 /100 | #121 | Exceptional 10.6% |
| Immigrants | Norway | 95.0 /100 | #122 | Exceptional 10.6% |
| Maltese | 94.8 /100 | #123 | Exceptional 10.6% |