Spaniard vs Nigerian Disability Age 35 to 64
COMPARE
Spaniard
Nigerian
Disability Age 35 to 64
Disability Age 35 to 64 Comparison
Spaniards
Nigerians
12.3%
DISABILITY AGE 35 TO 64
1.3/ 100
METRIC RATING
248th/ 347
METRIC RANK
11.6%
DISABILITY AGE 35 TO 64
16.3/ 100
METRIC RATING
204th/ 347
METRIC RANK
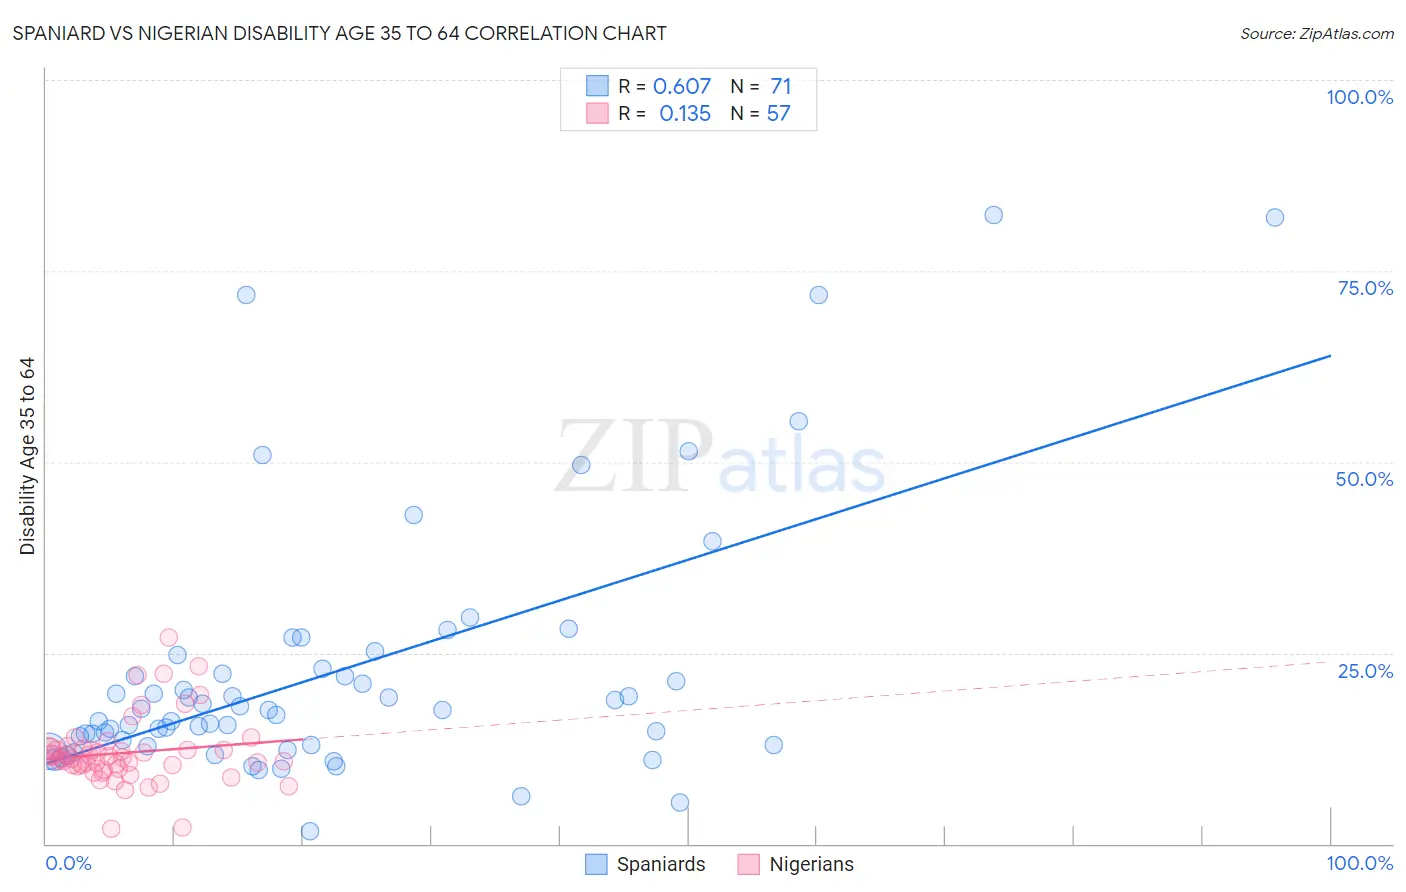
Spaniard vs Nigerian Disability Age 35 to 64 Correlation Chart
The statistical analysis conducted on geographies consisting of 443,075,897 people shows a significant positive correlation between the proportion of Spaniards and percentage of population with a disability between the ages 34 and 64 in the United States with a correlation coefficient (R) of 0.607 and weighted average of 12.3%. Similarly, the statistical analysis conducted on geographies consisting of 332,461,333 people shows a poor positive correlation between the proportion of Nigerians and percentage of population with a disability between the ages 34 and 64 in the United States with a correlation coefficient (R) of 0.135 and weighted average of 11.6%, a difference of 5.3%.
Disability Age 35 to 64 Correlation Summary
| Measurement | Spaniard | Nigerian |
| Minimum | 1.6% | 1.9% |
| Maximum | 82.3% | 27.1% |
| Range | 80.7% | 25.2% |
| Mean | 22.5% | 11.9% |
| Median | 17.5% | 11.2% |
| Interquartile 25% (IQ1) | 12.9% | 10.0% |
| Interquartile 75% (IQ3) | 23.0% | 12.4% |
| Interquartile Range (IQR) | 10.1% | 2.4% |
| Standard Deviation (Sample) | 17.1% | 4.5% |
| Standard Deviation (Population) | 16.9% | 4.4% |
Similar Demographics by Disability Age 35 to 64
Demographics Similar to Spaniards by Disability Age 35 to 64
In terms of disability age 35 to 64, the demographic groups most similar to Spaniards are Hispanic or Latino (12.3%, a difference of 0.030%), Immigrants from Senegal (12.2%, a difference of 0.10%), Guamanian/Chamorro (12.2%, a difference of 0.13%), Immigrants from Burma/Myanmar (12.3%, a difference of 0.16%), and German (12.3%, a difference of 0.24%).
| Demographics | Rating | Rank | Disability Age 35 to 64 |
| Mexican American Indians | 3.2 /100 | #241 | Tragic 12.0% |
| Samoans | 2.8 /100 | #242 | Tragic 12.1% |
| Slovaks | 2.7 /100 | #243 | Tragic 12.1% |
| Finns | 2.3 /100 | #244 | Tragic 12.1% |
| Immigrants | Mexico | 2.2 /100 | #245 | Tragic 12.1% |
| Guamanians/Chamorros | 1.4 /100 | #246 | Tragic 12.2% |
| Immigrants | Senegal | 1.3 /100 | #247 | Tragic 12.2% |
| Spaniards | 1.3 /100 | #248 | Tragic 12.3% |
| Hispanics or Latinos | 1.3 /100 | #249 | Tragic 12.3% |
| Immigrants | Burma/Myanmar | 1.2 /100 | #250 | Tragic 12.3% |
| Germans | 1.1 /100 | #251 | Tragic 12.3% |
| Irish | 1.0 /100 | #252 | Tragic 12.3% |
| Dutch | 1.0 /100 | #253 | Tragic 12.3% |
| Hawaiians | 0.9 /100 | #254 | Tragic 12.3% |
| Japanese | 0.8 /100 | #255 | Tragic 12.3% |
Demographics Similar to Nigerians by Disability Age 35 to 64
In terms of disability age 35 to 64, the demographic groups most similar to Nigerians are British (11.6%, a difference of 0.11%), Slavic (11.7%, a difference of 0.11%), Immigrants from Guatemala (11.6%, a difference of 0.17%), Immigrants from Kenya (11.6%, a difference of 0.20%), and Native Hawaiian (11.7%, a difference of 0.21%).
| Demographics | Rating | Rank | Disability Age 35 to 64 |
| Immigrants | Iraq | 21.0 /100 | #197 | Fair 11.6% |
| Immigrants | Panama | 20.4 /100 | #198 | Fair 11.6% |
| Basques | 19.5 /100 | #199 | Poor 11.6% |
| Swiss | 18.7 /100 | #200 | Poor 11.6% |
| Immigrants | Kenya | 17.7 /100 | #201 | Poor 11.6% |
| Immigrants | Guatemala | 17.5 /100 | #202 | Poor 11.6% |
| British | 17.0 /100 | #203 | Poor 11.6% |
| Nigerians | 16.3 /100 | #204 | Poor 11.6% |
| Slavs | 15.5 /100 | #205 | Poor 11.7% |
| Native Hawaiians | 14.8 /100 | #206 | Poor 11.7% |
| Ghanaians | 14.8 /100 | #207 | Poor 11.7% |
| Guatemalans | 14.6 /100 | #208 | Poor 11.7% |
| Europeans | 13.5 /100 | #209 | Poor 11.7% |
| Belgians | 13.1 /100 | #210 | Poor 11.7% |
| Canadians | 13.0 /100 | #211 | Poor 11.7% |