South American Indian vs Immigrants from Northern Africa Disability Age Over 75
COMPARE
South American Indian
Immigrants from Northern Africa
Disability Age Over 75
Disability Age Over 75 Comparison
South American Indians
Immigrants from Northern Africa
47.1%
DISABILITY AGE OVER 75
68.1/ 100
METRIC RATING
161st/ 347
METRIC RANK
46.7%
DISABILITY AGE OVER 75
90.7/ 100
METRIC RATING
130th/ 347
METRIC RANK
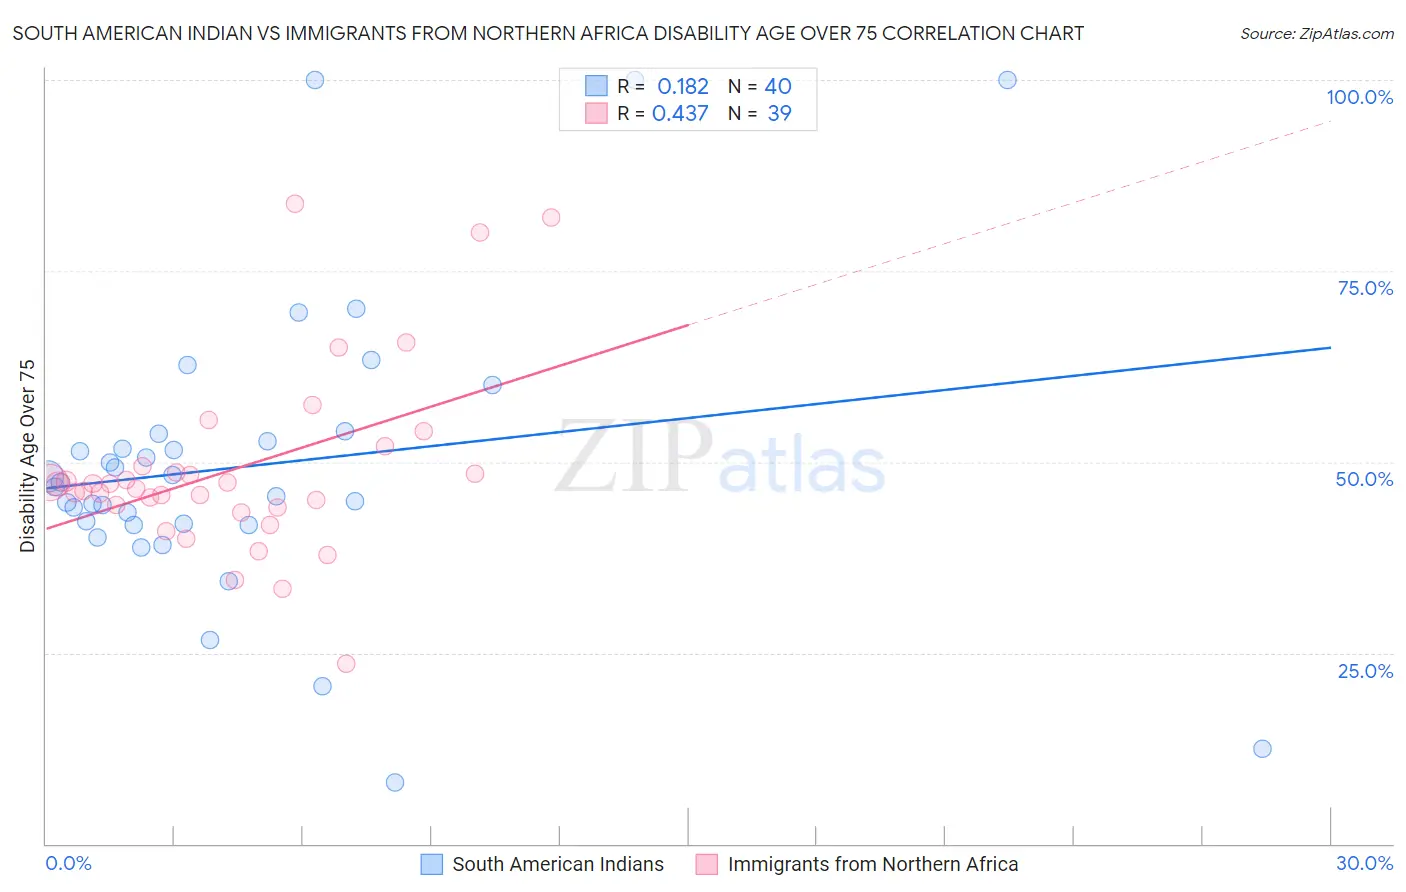
South American Indian vs Immigrants from Northern Africa Disability Age Over 75 Correlation Chart
The statistical analysis conducted on geographies consisting of 164,514,334 people shows a poor positive correlation between the proportion of South American Indians and percentage of population with a disability over the age of 75 in the United States with a correlation coefficient (R) of 0.182 and weighted average of 47.1%. Similarly, the statistical analysis conducted on geographies consisting of 320,946,648 people shows a moderate positive correlation between the proportion of Immigrants from Northern Africa and percentage of population with a disability over the age of 75 in the United States with a correlation coefficient (R) of 0.437 and weighted average of 46.7%, a difference of 0.86%.
Disability Age Over 75 Correlation Summary
| Measurement | South American Indian | Immigrants from Northern Africa |
| Minimum | 8.0% | 23.5% |
| Maximum | 100.0% | 83.8% |
| Range | 92.0% | 60.2% |
| Mean | 49.5% | 49.0% |
| Median | 47.0% | 47.1% |
| Interquartile 25% (IQ1) | 41.8% | 44.0% |
| Interquartile 75% (IQ3) | 53.2% | 49.4% |
| Interquartile Range (IQR) | 11.4% | 5.4% |
| Standard Deviation (Sample) | 19.2% | 12.2% |
| Standard Deviation (Population) | 19.0% | 12.1% |
Similar Demographics by Disability Age Over 75
Demographics Similar to South American Indians by Disability Age Over 75
In terms of disability age over 75, the demographic groups most similar to South American Indians are Immigrants from Middle Africa (47.1%, a difference of 0.010%), Pennsylvania German (47.2%, a difference of 0.050%), Immigrants from Eastern Africa (47.2%, a difference of 0.070%), Immigrants from Morocco (47.1%, a difference of 0.090%), and French (47.2%, a difference of 0.090%).
| Demographics | Rating | Rank | Disability Age Over 75 |
| Immigrants | Belarus | 74.8 /100 | #154 | Good 47.1% |
| Immigrants | Iran | 74.7 /100 | #155 | Good 47.1% |
| Arabs | 73.3 /100 | #156 | Good 47.1% |
| Bhutanese | 72.6 /100 | #157 | Good 47.1% |
| Immigrants | Guyana | 71.9 /100 | #158 | Good 47.1% |
| Immigrants | Morocco | 71.4 /100 | #159 | Good 47.1% |
| Immigrants | Middle Africa | 68.3 /100 | #160 | Good 47.1% |
| South American Indians | 68.1 /100 | #161 | Good 47.1% |
| Pennsylvania Germans | 66.0 /100 | #162 | Good 47.2% |
| Immigrants | Eastern Africa | 65.5 /100 | #163 | Good 47.2% |
| French | 64.6 /100 | #164 | Good 47.2% |
| Immigrants | Zimbabwe | 64.4 /100 | #165 | Good 47.2% |
| Immigrants | Sierra Leone | 64.4 /100 | #166 | Good 47.2% |
| Moroccans | 62.9 /100 | #167 | Good 47.2% |
| Kenyans | 58.8 /100 | #168 | Average 47.2% |
Demographics Similar to Immigrants from Northern Africa by Disability Age Over 75
In terms of disability age over 75, the demographic groups most similar to Immigrants from Northern Africa are Icelander (46.7%, a difference of 0.010%), Immigrants from Germany (46.7%, a difference of 0.010%), Scottish (46.7%, a difference of 0.010%), Syrian (46.7%, a difference of 0.030%), and Colombian (46.7%, a difference of 0.040%).
| Demographics | Rating | Rank | Disability Age Over 75 |
| Immigrants | Colombia | 92.6 /100 | #123 | Exceptional 46.7% |
| Immigrants | South America | 91.8 /100 | #124 | Exceptional 46.7% |
| Colombians | 91.3 /100 | #125 | Exceptional 46.7% |
| Europeans | 91.2 /100 | #126 | Exceptional 46.7% |
| Syrians | 91.1 /100 | #127 | Exceptional 46.7% |
| Icelanders | 90.9 /100 | #128 | Exceptional 46.7% |
| Immigrants | Germany | 90.8 /100 | #129 | Exceptional 46.7% |
| Immigrants | Northern Africa | 90.7 /100 | #130 | Exceptional 46.7% |
| Scottish | 90.5 /100 | #131 | Exceptional 46.7% |
| South Americans | 90.0 /100 | #132 | Excellent 46.8% |
| English | 89.4 /100 | #133 | Excellent 46.8% |
| Immigrants | Ethiopia | 89.1 /100 | #134 | Excellent 46.8% |
| Ethiopians | 88.9 /100 | #135 | Excellent 46.8% |
| Immigrants | Venezuela | 88.6 /100 | #136 | Excellent 46.8% |
| Immigrants | Uganda | 88.5 /100 | #137 | Excellent 46.8% |