Shoshone vs Immigrants Disability Age 18 to 34
COMPARE
Shoshone
Immigrants
Disability Age 18 to 34
Disability Age 18 to 34 Comparison
Shoshone
Immigrants
7.8%
DISABILITY AGE 18 TO 34
0.0/ 100
METRIC RATING
304th/ 347
METRIC RANK
6.2%
DISABILITY AGE 18 TO 34
97.6/ 100
METRIC RATING
93rd/ 347
METRIC RANK
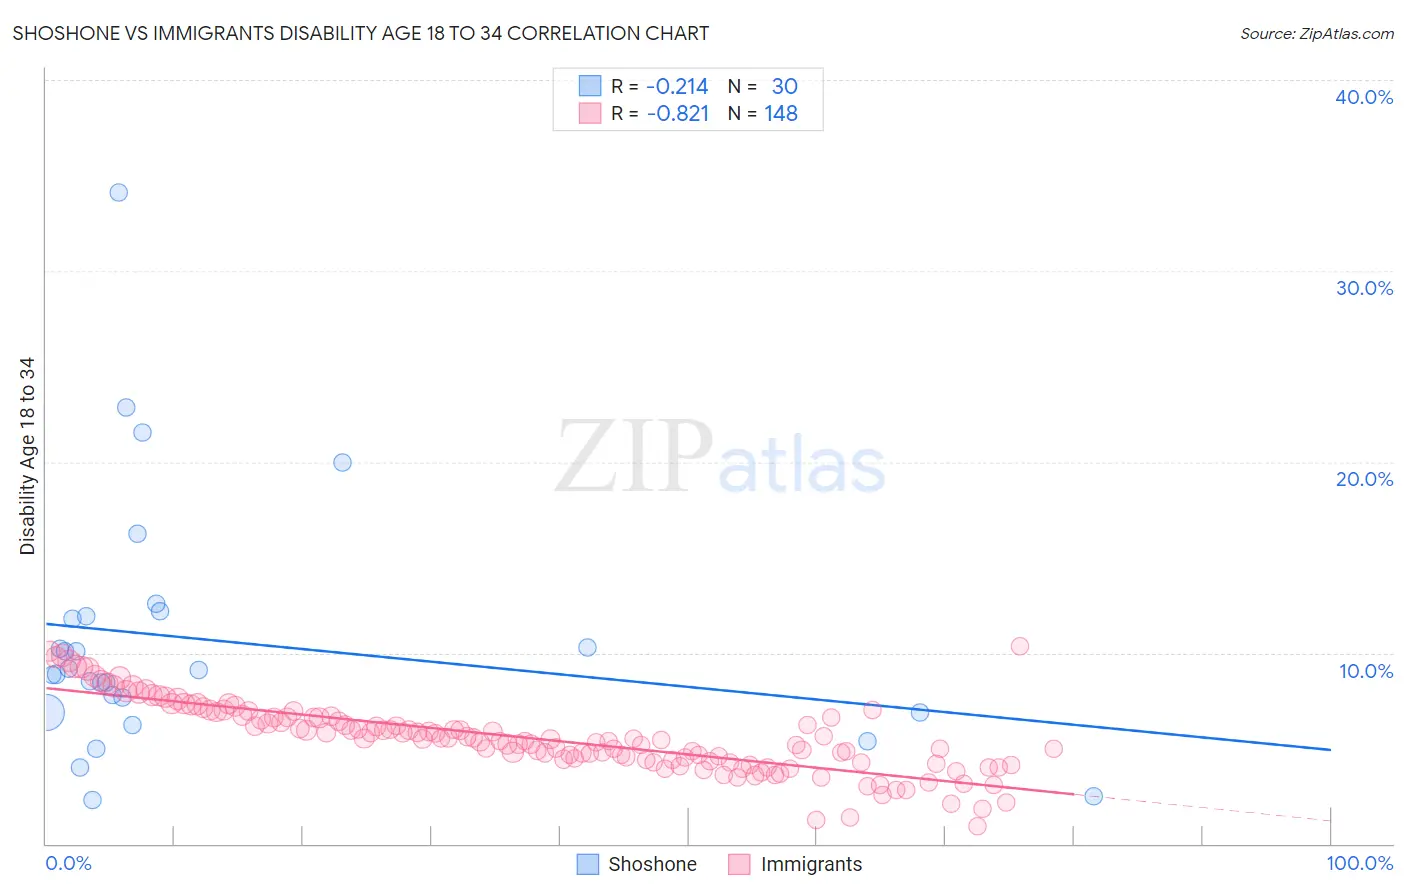
Shoshone vs Immigrants Disability Age 18 to 34 Correlation Chart
The statistical analysis conducted on geographies consisting of 66,530,861 people shows a weak negative correlation between the proportion of Shoshone and percentage of population with a disability between the ages 18 and 35 in the United States with a correlation coefficient (R) of -0.214 and weighted average of 7.8%. Similarly, the statistical analysis conducted on geographies consisting of 571,309,041 people shows a very strong negative correlation between the proportion of Immigrants and percentage of population with a disability between the ages 18 and 35 in the United States with a correlation coefficient (R) of -0.821 and weighted average of 6.2%, a difference of 25.8%.
Disability Age 18 to 34 Correlation Summary
| Measurement | Shoshone | Immigrants |
| Minimum | 2.3% | 0.92% |
| Maximum | 34.1% | 10.3% |
| Range | 31.8% | 9.4% |
| Mean | 10.7% | 5.6% |
| Median | 9.0% | 5.5% |
| Interquartile 25% (IQ1) | 6.9% | 4.4% |
| Interquartile 75% (IQ3) | 11.9% | 6.6% |
| Interquartile Range (IQR) | 5.1% | 2.3% |
| Standard Deviation (Sample) | 6.6% | 1.8% |
| Standard Deviation (Population) | 6.5% | 1.8% |
Similar Demographics by Disability Age 18 to 34
Demographics Similar to Shoshone by Disability Age 18 to 34
In terms of disability age 18 to 34, the demographic groups most similar to Shoshone are Menominee (7.8%, a difference of 0.080%), English (7.8%, a difference of 0.16%), Cheyenne (7.7%, a difference of 0.34%), Welsh (7.7%, a difference of 0.41%), and Scotch-Irish (7.8%, a difference of 0.42%).
| Demographics | Rating | Rank | Disability Age 18 to 34 |
| Pueblo | 0.0 /100 | #297 | Tragic 7.7% |
| Dutch | 0.0 /100 | #298 | Tragic 7.7% |
| Germans | 0.0 /100 | #299 | Tragic 7.7% |
| Scottish | 0.0 /100 | #300 | Tragic 7.7% |
| Pima | 0.0 /100 | #301 | Tragic 7.7% |
| Welsh | 0.0 /100 | #302 | Tragic 7.7% |
| Cheyenne | 0.0 /100 | #303 | Tragic 7.7% |
| Shoshone | 0.0 /100 | #304 | Tragic 7.8% |
| Menominee | 0.0 /100 | #305 | Tragic 7.8% |
| English | 0.0 /100 | #306 | Tragic 7.8% |
| Scotch-Irish | 0.0 /100 | #307 | Tragic 7.8% |
| Pennsylvania Germans | 0.0 /100 | #308 | Tragic 7.8% |
| Alaska Natives | 0.0 /100 | #309 | Tragic 7.8% |
| Finns | 0.0 /100 | #310 | Tragic 7.8% |
| French | 0.0 /100 | #311 | Tragic 7.9% |
Demographics Similar to Immigrants by Disability Age 18 to 34
In terms of disability age 18 to 34, the demographic groups most similar to Immigrants are Jordanian (6.2%, a difference of 0.030%), Immigrants from Kazakhstan (6.2%, a difference of 0.050%), Immigrants from Philippines (6.2%, a difference of 0.070%), Central American (6.2%, a difference of 0.080%), and Immigrants from Uruguay (6.2%, a difference of 0.12%).
| Demographics | Rating | Rank | Disability Age 18 to 34 |
| Immigrants | Kuwait | 98.0 /100 | #86 | Exceptional 6.2% |
| Immigrants | Eastern Europe | 97.9 /100 | #87 | Exceptional 6.2% |
| Cambodians | 97.8 /100 | #88 | Exceptional 6.2% |
| Turks | 97.8 /100 | #89 | Exceptional 6.2% |
| Immigrants | Vietnam | 97.7 /100 | #90 | Exceptional 6.2% |
| Immigrants | Philippines | 97.6 /100 | #91 | Exceptional 6.2% |
| Jordanians | 97.6 /100 | #92 | Exceptional 6.2% |
| Immigrants | Immigrants | 97.6 /100 | #93 | Exceptional 6.2% |
| Immigrants | Kazakhstan | 97.5 /100 | #94 | Exceptional 6.2% |
| Central Americans | 97.5 /100 | #95 | Exceptional 6.2% |
| Immigrants | Uruguay | 97.4 /100 | #96 | Exceptional 6.2% |
| Uruguayans | 97.3 /100 | #97 | Exceptional 6.2% |
| Immigrants | Syria | 97.2 /100 | #98 | Exceptional 6.2% |
| Immigrants | Ethiopia | 96.9 /100 | #99 | Exceptional 6.2% |
| Immigrants | Albania | 96.7 /100 | #100 | Exceptional 6.2% |