Serbian vs Pennsylvania German Disability Age 18 to 34
COMPARE
Serbian
Pennsylvania German
Disability Age 18 to 34
Disability Age 18 to 34 Comparison
Serbians
Pennsylvania Germans
6.9%
DISABILITY AGE 18 TO 34
8.2/ 100
METRIC RATING
214th/ 347
METRIC RANK
7.8%
DISABILITY AGE 18 TO 34
0.0/ 100
METRIC RATING
308th/ 347
METRIC RANK
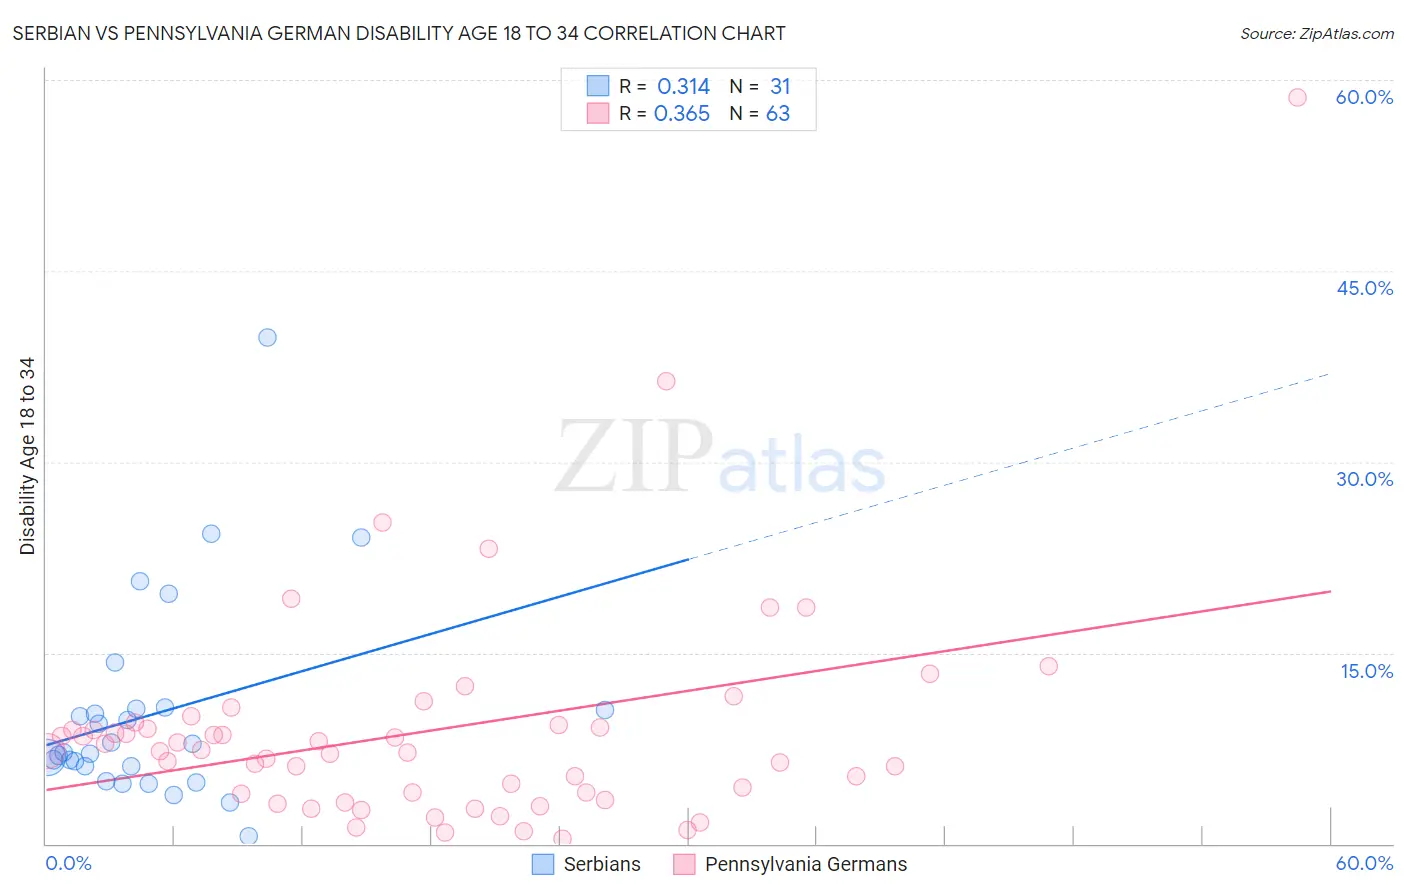
Serbian vs Pennsylvania German Disability Age 18 to 34 Correlation Chart
The statistical analysis conducted on geographies consisting of 267,177,394 people shows a mild positive correlation between the proportion of Serbians and percentage of population with a disability between the ages 18 and 35 in the United States with a correlation coefficient (R) of 0.314 and weighted average of 6.9%. Similarly, the statistical analysis conducted on geographies consisting of 233,477,227 people shows a mild positive correlation between the proportion of Pennsylvania Germans and percentage of population with a disability between the ages 18 and 35 in the United States with a correlation coefficient (R) of 0.365 and weighted average of 7.8%, a difference of 13.6%.
Disability Age 18 to 34 Correlation Summary
| Measurement | Serbian | Pennsylvania German |
| Minimum | 0.58% | 0.39% |
| Maximum | 39.8% | 58.7% |
| Range | 39.2% | 58.3% |
| Mean | 10.2% | 8.9% |
| Median | 7.1% | 7.3% |
| Interquartile 25% (IQ1) | 6.1% | 4.0% |
| Interquartile 75% (IQ3) | 10.6% | 9.3% |
| Interquartile Range (IQR) | 4.5% | 5.4% |
| Standard Deviation (Sample) | 8.0% | 9.0% |
| Standard Deviation (Population) | 7.8% | 8.9% |
Similar Demographics by Disability Age 18 to 34
Demographics Similar to Serbians by Disability Age 18 to 34
In terms of disability age 18 to 34, the demographic groups most similar to Serbians are Immigrants from Thailand (6.9%, a difference of 0.16%), Immigrants from Western Europe (6.9%, a difference of 0.18%), Luxembourger (6.9%, a difference of 0.25%), Sudanese (6.9%, a difference of 0.29%), and Immigrants from Kenya (6.9%, a difference of 0.31%).
| Demographics | Rating | Rank | Disability Age 18 to 34 |
| Mexicans | 12.6 /100 | #207 | Poor 6.8% |
| Immigrants | Scotland | 12.4 /100 | #208 | Poor 6.8% |
| Immigrants | Burma/Myanmar | 12.3 /100 | #209 | Poor 6.8% |
| Latvians | 11.1 /100 | #210 | Poor 6.8% |
| Immigrants | Norway | 10.0 /100 | #211 | Tragic 6.8% |
| Luxembourgers | 9.4 /100 | #212 | Tragic 6.9% |
| Immigrants | Western Europe | 9.1 /100 | #213 | Tragic 6.9% |
| Serbians | 8.2 /100 | #214 | Tragic 6.9% |
| Immigrants | Thailand | 7.5 /100 | #215 | Tragic 6.9% |
| Sudanese | 7.0 /100 | #216 | Tragic 6.9% |
| Immigrants | Kenya | 6.9 /100 | #217 | Tragic 6.9% |
| Ukrainians | 6.7 /100 | #218 | Tragic 6.9% |
| Hawaiians | 6.5 /100 | #219 | Tragic 6.9% |
| Immigrants | Senegal | 5.5 /100 | #220 | Tragic 6.9% |
| Immigrants | Middle Africa | 5.5 /100 | #221 | Tragic 6.9% |
Demographics Similar to Pennsylvania Germans by Disability Age 18 to 34
In terms of disability age 18 to 34, the demographic groups most similar to Pennsylvania Germans are Alaska Native (7.8%, a difference of 0.010%), Scotch-Irish (7.8%, a difference of 0.030%), Finnish (7.8%, a difference of 0.070%), English (7.8%, a difference of 0.28%), and Menominee (7.8%, a difference of 0.37%).
| Demographics | Rating | Rank | Disability Age 18 to 34 |
| Pima | 0.0 /100 | #301 | Tragic 7.7% |
| Welsh | 0.0 /100 | #302 | Tragic 7.7% |
| Cheyenne | 0.0 /100 | #303 | Tragic 7.7% |
| Shoshone | 0.0 /100 | #304 | Tragic 7.8% |
| Menominee | 0.0 /100 | #305 | Tragic 7.8% |
| English | 0.0 /100 | #306 | Tragic 7.8% |
| Scotch-Irish | 0.0 /100 | #307 | Tragic 7.8% |
| Pennsylvania Germans | 0.0 /100 | #308 | Tragic 7.8% |
| Alaska Natives | 0.0 /100 | #309 | Tragic 7.8% |
| Finns | 0.0 /100 | #310 | Tragic 7.8% |
| French | 0.0 /100 | #311 | Tragic 7.9% |
| Spanish Americans | 0.0 /100 | #312 | Tragic 7.9% |
| Iroquois | 0.0 /100 | #313 | Tragic 7.9% |
| Colville | 0.0 /100 | #314 | Tragic 7.9% |
| Americans | 0.0 /100 | #315 | Tragic 8.0% |