Seminole vs Immigrants from Scotland Disability Age 18 to 34

COMPARE

Seminole
Race
Ancestry
AfghanAfricanAlaska NativeAlaskan AthabascanAlbanianAleutAlsatianAmericanApacheArabArapahoArgentineanArmenianAssyrian/Chaldean/SyriacAustralianAustrianBahamianBangladeshiBarbadianBasqueBelgianBelizeanBermudanBhutaneseBlackfeetBolivianBrazilianBritishBritish West IndianBulgarianBurmeseCajunCambodianCanadianCape VerdeanCarpatho RusynCelticCentral AmericanCentral American IndianCherokeeCheyenneChickasawChileanChineseChippewaChoctawColombianColvilleComancheCosta RicanCreeCreekCroatianCrowCubanCypriotCzechCzechoslovakianDanishDelawareDominicanDutchDutch West IndianEastern EuropeanEcuadorianEgyptianEnglishEstonianEthiopianEuropeanFijianFilipinoFinnishFrenchFrench American IndianFrench CanadianGermanGerman RussianGhanaianGreekGuamanian/ChamorroGuatemalanGuyaneseHaitianHmongHonduranHopiHoumaHungarianIcelanderIndian (Asian)IndonesianInupiatIranianIraqiIrishIroquoisIsraeliItalianJamaicanJapaneseJordanianKenyanKiowaKoreanLaotianLatvianLebaneseLiberianLithuanianLumbeeLuxembourgerMacedonianMalaysianMalteseMarshalleseMenomineeMexicanMexican American IndianMongolianMoroccanNative HawaiianNavajoNepaleseNew ZealanderNicaraguanNigerianNorthern EuropeanNorwegianOkinawanOsageOttawaPaiutePakistaniPalestinianPanamanianParaguayanPennsylvania GermanPeruvianPimaPolishPortuguesePotawatomiPuebloPuerto RicanPuget Sound SalishRomanianRussianSalvadoranSamoanScandinavianScotch-IrishScottishSeminoleSenegaleseSerbianShoshoneSierra LeoneanSiouxSlavicSlovakSloveneSomaliSouth AfricanSouth AmericanSouth American IndianSoviet UnionSpaniardSpanishSpanish AmericanSpanish American IndianSri LankanSubsaharan AfricanSudaneseSwedishSwissSyrianTaiwaneseThaiTlingit-HaidaTohono O'OdhamTonganTrinidadian and TobagonianTsimshianTurkishU.S. Virgin IslanderUgandanUkrainianUruguayanUteVenezuelanVietnameseWelshWest IndianYakamaYaquiYugoslavianYumanYup'ikZimbabwean
Immigration
NonimmigrantsImmigrantsAfghanistanAfricaAlbaniaArgentinaArmeniaAsiaAustraliaAustriaBahamasBangladeshBarbadosBelarusBelgiumBelizeBoliviaBosnia and HerzegovinaBrazilBulgariaBurma/MyanmarCabo VerdeCambodiaCameroonCanadaCaribbeanCentral AmericaChileChinaColombiaCongoCosta RicaCroatiaCubaCzechoslovakiaDenmarkDominicaDominican RepublicEastern AfricaEastern AsiaEastern EuropeEcuadorEgyptEl SalvadorEnglandEritreaEthiopiaEuropeFijiFranceGermanyGhanaGreeceGrenadaGuatemalaGuyanaHaitiHondurasHong KongHungaryIndiaIndonesiaIranIraqIrelandIsraelItalyJamaicaJapanJordanKazakhstanKenyaKoreaKuwaitLaosLatin AmericaLatviaLebanonLiberiaLithuaniaMalaysiaMexicoMicronesiaMiddle AfricaMoldovaMoroccoNepalNetherlandsNicaraguaNigeriaNorth AmericaNorth MacedoniaNorthern AfricaNorthern EuropeNorwayOceaniaPakistanPanamaPeruPhilippinesPolandPortugalRomaniaRussiaSaudi ArabiaSenegalSerbiaSierra LeoneSingaporeSomaliaSouth AfricaSouth AmericaSouth Central AsiaSouth Eastern AsiaSouthern EuropeSpainSri LankaSt. Vincent and the GrenadinesSudanSwedenSwitzerlandSyriaTaiwanThailandTrinidad and TobagoTurkeyUgandaUkraineUruguayUzbekistanVenezuelaVietnamWest IndiesWestern AfricaWestern AsiaWestern EuropeYemenZaireZimbabweAzores
Immigrants from Scotland
Race
Ancestry
AfghanAfricanAlaska NativeAlaskan AthabascanAlbanianAleutAlsatianAmericanApacheArabArapahoArgentineanArmenianAssyrian/Chaldean/SyriacAustralianAustrianBahamianBangladeshiBarbadianBasqueBelgianBelizeanBermudanBhutaneseBlackfeetBolivianBrazilianBritishBritish West IndianBulgarianBurmeseCajunCambodianCanadianCape VerdeanCarpatho RusynCelticCentral AmericanCentral American IndianCherokeeCheyenneChickasawChileanChineseChippewaChoctawColombianColvilleComancheCosta RicanCreeCreekCroatianCrowCubanCypriotCzechCzechoslovakianDanishDelawareDominicanDutchDutch West IndianEastern EuropeanEcuadorianEgyptianEnglishEstonianEthiopianEuropeanFijianFilipinoFinnishFrenchFrench American IndianFrench CanadianGermanGerman RussianGhanaianGreekGuamanian/ChamorroGuatemalanGuyaneseHaitianHmongHonduranHopiHoumaHungarianIcelanderIndian (Asian)IndonesianInupiatIranianIraqiIrishIroquoisIsraeliItalianJamaicanJapaneseJordanianKenyanKiowaKoreanLaotianLatvianLebaneseLiberianLithuanianLumbeeLuxembourgerMacedonianMalaysianMalteseMarshalleseMenomineeMexicanMexican American IndianMongolianMoroccanNative HawaiianNavajoNepaleseNew ZealanderNicaraguanNigerianNorthern EuropeanNorwegianOkinawanOsageOttawaPaiutePakistaniPalestinianPanamanianParaguayanPennsylvania GermanPeruvianPimaPolishPortuguesePotawatomiPuebloPuerto RicanPuget Sound SalishRomanianRussianSalvadoranSamoanScandinavianScotch-IrishScottishSenegaleseSerbianShoshoneSierra LeoneanSiouxSlavicSlovakSloveneSomaliSouth AfricanSouth AmericanSouth American IndianSoviet UnionSpaniardSpanishSpanish AmericanSpanish American IndianSri LankanSubsaharan AfricanSudaneseSwedishSwissSyrianTaiwaneseThaiTlingit-HaidaTohono O'OdhamTonganTrinidadian and TobagonianTsimshianTurkishU.S. Virgin IslanderUgandanUkrainianUruguayanUteVenezuelanVietnameseWelshWest IndianYakamaYaquiYugoslavianYumanYup'ikZimbabwean
Immigration
NonimmigrantsImmigrantsAfghanistanAfricaAlbaniaArgentinaArmeniaAsiaAustraliaAustriaBahamasBangladeshBarbadosBelarusBelgiumBelizeBoliviaBosnia and HerzegovinaBrazilBulgariaBurma/MyanmarCabo VerdeCambodiaCameroonCanadaCaribbeanCentral AmericaChileChinaColombiaCongoCosta RicaCroatiaCubaCzechoslovakiaDenmarkDominicaDominican RepublicEastern AfricaEastern AsiaEastern EuropeEcuadorEgyptEl SalvadorEnglandEritreaEthiopiaEuropeFijiFranceGermanyGhanaGreeceGrenadaGuatemalaGuyanaHaitiHondurasHong KongHungaryIndiaIndonesiaIranIraqIrelandIsraelItalyJamaicaJapanJordanKazakhstanKenyaKoreaKuwaitLaosLatin AmericaLatviaLebanonLiberiaLithuaniaMalaysiaMexicoMicronesiaMiddle AfricaMoldovaMoroccoNepalNetherlandsNicaraguaNigeriaNorth AmericaNorth MacedoniaNorthern AfricaNorthern EuropeNorwayOceaniaPakistanPanamaPeruPhilippinesPolandPortugalRomaniaRussiaSaudi ArabiaScotlandSenegalSerbiaSierra LeoneSingaporeSomaliaSouth AfricaSouth AmericaSouth Central AsiaSouth Eastern AsiaSouthern EuropeSpainSri LankaSt. Vincent and the GrenadinesSudanSwedenSwitzerlandSyriaTaiwanThailandTrinidad and TobagoTurkeyUgandaUkraineUruguayUzbekistanVenezuelaVietnamWest IndiesWestern AfricaWestern AsiaWestern EuropeYemenZaireZimbabweAzores
Disability Age 18 to 34
Income
Poverty
Unemployment
Labor Participation
Family Structure
Vehicle Availability
Education Level
Disability

Disability Age 18 to 34 Comparison

Seminole

Immigrants from Scotland

Tragic
Poor
8.4%
DISABILITY AGE 18 TO 34
0.0/ 100
METRIC RATING
335th/ 347
METRIC RANK
6.8%
DISABILITY AGE 18 TO 34
12.4/ 100
METRIC RATING
208th/ 347
METRIC RANK

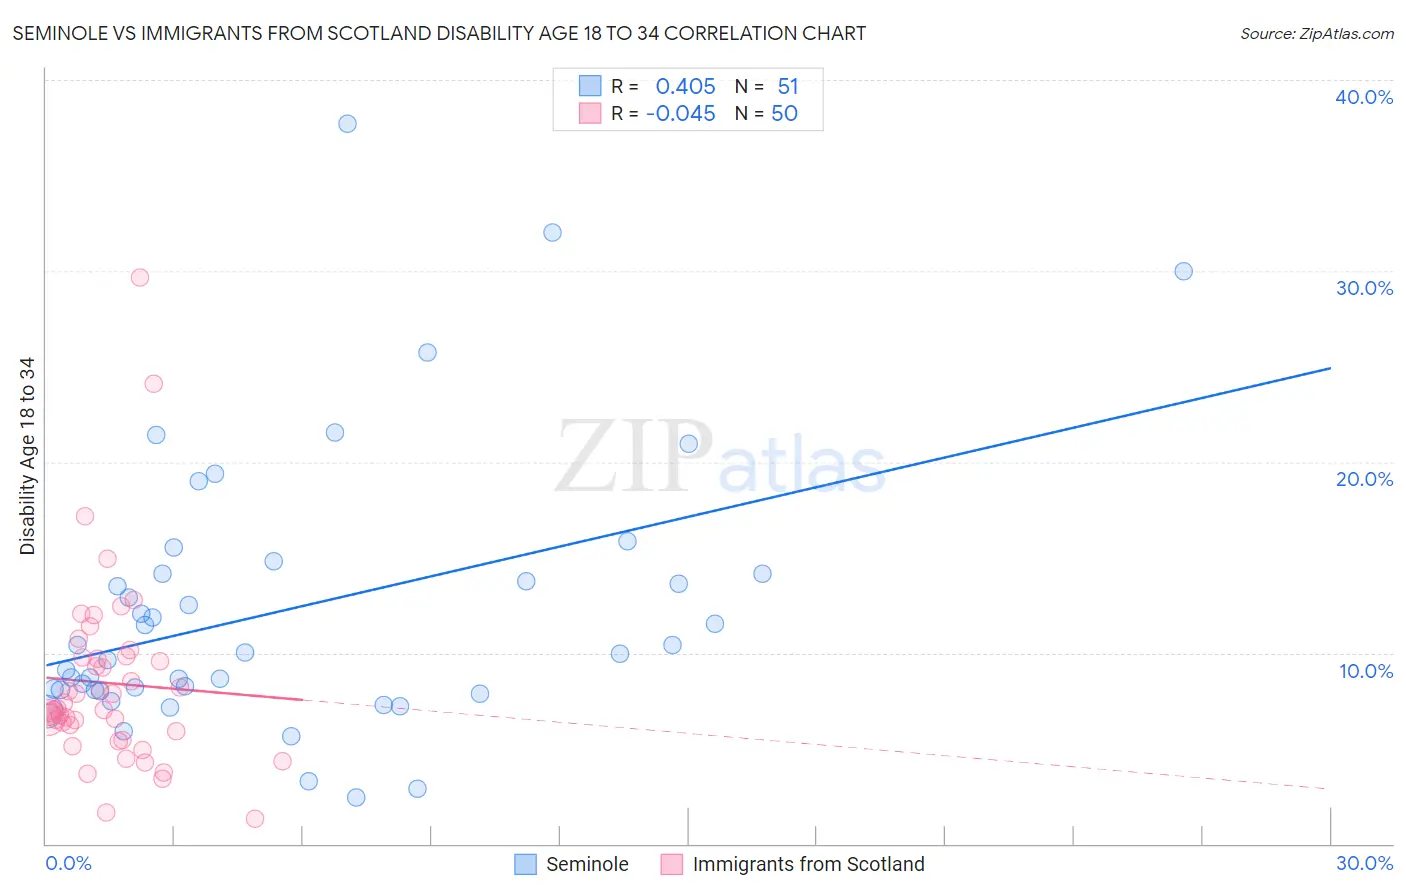
Seminole vs Immigrants from Scotland Disability Age 18 to 34 Correlation Chart

The statistical analysis conducted on geographies consisting of 118,263,195 people shows a moderate positive correlation between the proportion of Seminole and percentage of population with a disability between the ages 18 and 35 in the United States with a correlation coefficient (R) of 0.405 and weighted average of 8.4%. Similarly, the statistical analysis conducted on geographies consisting of 196,150,775 people shows no correlation between the proportion of Immigrants from Scotland and percentage of population with a disability between the ages 18 and 35 in the United States with a correlation coefficient (R) of -0.045 and weighted average of 6.8%, a difference of 23.8%.
Seminole vs Immigrants from Scotland Disability Age 18 to 34

Disability Age 18 to 34 Correlation Summary

MeasurementSeminoleImmigrants from Scotland
Minimum2.4%1.3%
Maximum37.7%29.7%
Range35.3%28.3%
Mean12.4%8.4%
Median10.0%7.0%
Interquartile 25% (IQ1)8.1%5.9%
Interquartile 75% (IQ3)14.2%9.8%
Interquartile Range (IQR)6.1%3.9%
Standard Deviation (Sample)7.2%5.0%
Standard Deviation (Population)7.2%4.9%

Similar Demographics by Disability Age 18 to 34

Demographics Similar to Seminole by Disability Age 18 to 34

In terms of disability age 18 to 34, the demographic groups most similar to Seminole are Dutch West Indian (8.4%, a difference of 0.11%), Apache (8.4%, a difference of 0.33%), Immigrants from the Azores (8.5%, a difference of 1.2%), Puget Sound Salish (8.3%, a difference of 1.4%), and Comanche (8.3%, a difference of 1.6%).
DemographicsRating | RankDisability Age 18 to 34
Delaware
0.0
/100
|
#328
Tragic
8.2%
Crow
0.0
/100
|
#329
Tragic
8.3%
Osage
0.0
/100
|
#330
Tragic
8.3%
Comanche
0.0
/100
|
#331
Tragic
8.3%
Puget Sound Salish
0.0
/100
|
#332
Tragic
8.3%
Apache
0.0
/100
|
#333
Tragic
8.4%
Dutch West Indians
0.0
/100
|
#334
Tragic
8.4%
Seminole
0.0
/100
|
#335
Tragic
8.4%
Immigrants | Azores
0.0
/100
|
#336
Tragic
8.5%
Ottawa
0.0
/100
|
#337
Tragic
8.6%
Cherokee
0.0
/100
|
#338
Tragic
8.7%
Kiowa
0.0
/100
|
#339
Tragic
8.8%
Choctaw
0.0
/100
|
#340
Tragic
9.0%
Chickasaw
0.0
/100
|
#341
Tragic
9.0%
Yakama
0.0
/100
|
#342
Tragic
9.0%

Demographics Similar to Immigrants from Scotland by Disability Age 18 to 34

In terms of disability age 18 to 34, the demographic groups most similar to Immigrants from Scotland are Mexican (6.8%, a difference of 0.020%), Immigrants from Burma/Myanmar (6.8%, a difference of 0.020%), Japanese (6.8%, a difference of 0.050%), Lebanese (6.8%, a difference of 0.13%), and Immigrants from Bosnia and Herzegovina (6.8%, a difference of 0.18%).
DemographicsRating | RankDisability Age 18 to 34
Greeks
16.1
/100
|
#201
Poor
6.8%
Panamanians
15.8
/100
|
#202
Poor
6.8%
Hispanics or Latinos
13.8
/100
|
#203
Poor
6.8%
Immigrants | Bosnia and Herzegovina
13.6
/100
|
#204
Poor
6.8%
Lebanese
13.3
/100
|
#205
Poor
6.8%
Japanese
12.8
/100
|
#206
Poor
6.8%
Mexicans
12.6
/100
|
#207
Poor
6.8%
Immigrants | Scotland
12.4
/100
|
#208
Poor
6.8%
Immigrants | Burma/Myanmar
12.3
/100
|
#209
Poor
6.8%
Latvians
11.1
/100
|
#210
Poor
6.8%
Immigrants | Norway
10.0
/100
|
#211
Tragic
6.8%
Luxembourgers
9.4
/100
|
#212
Tragic
6.9%
Immigrants | Western Europe
9.1
/100
|
#213
Tragic
6.9%
Serbians
8.2
/100
|
#214
Tragic
6.9%
Immigrants | Thailand
7.5
/100
|
#215
Tragic
6.9%