Puerto Rican vs Immigrants from Latin America Disability Age 18 to 34
COMPARE
Puerto Rican
Immigrants from Latin America
Disability Age 18 to 34
Disability Age 18 to 34 Comparison
Puerto Ricans
Immigrants from Latin America
8.0%
DISABILITY AGE 18 TO 34
0.0/ 100
METRIC RATING
316th/ 347
METRIC RANK
6.3%
DISABILITY AGE 18 TO 34
94.9/ 100
METRIC RATING
113th/ 347
METRIC RANK
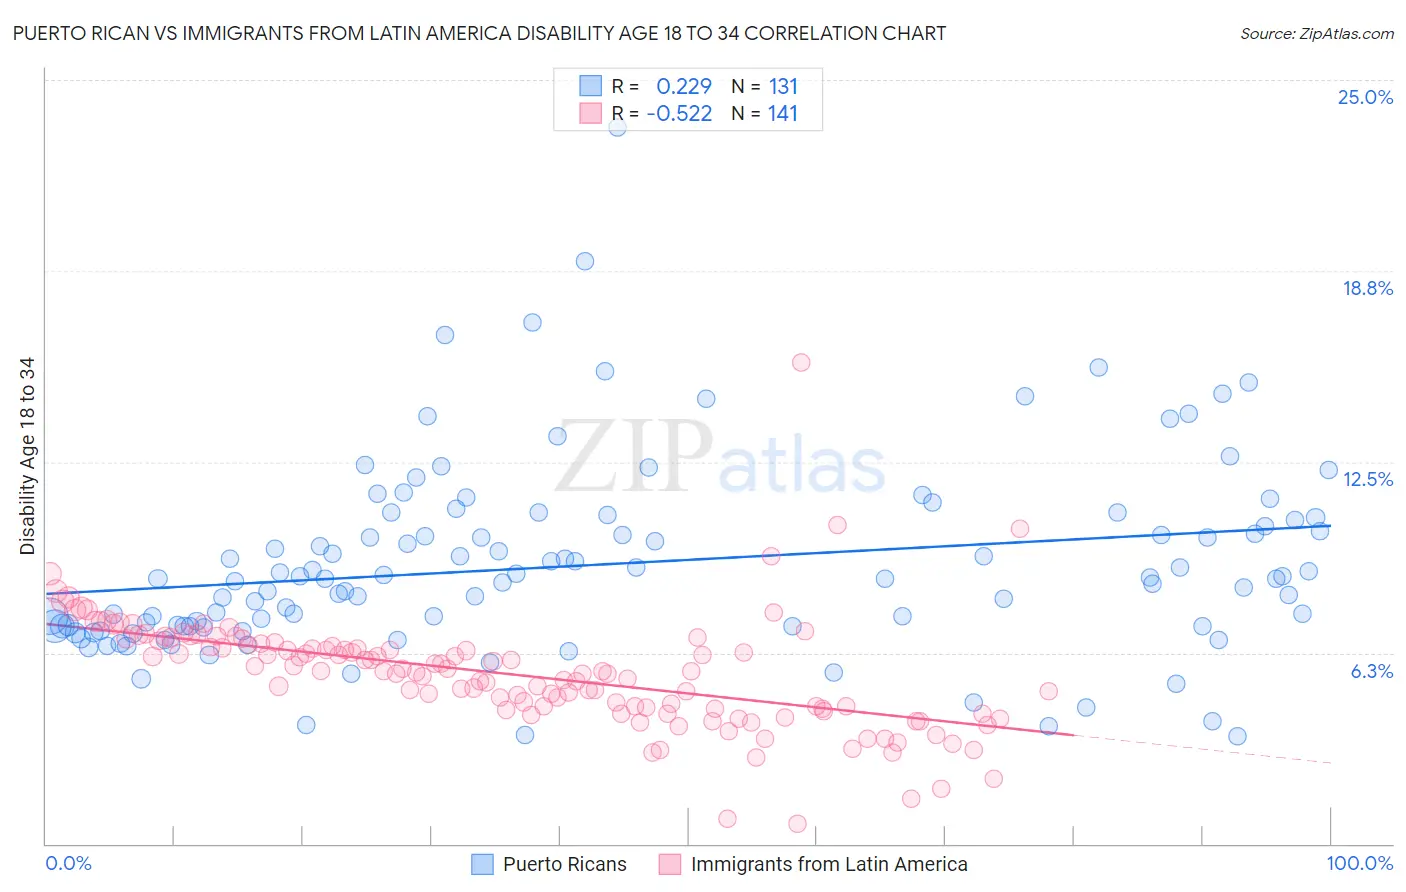
Puerto Rican vs Immigrants from Latin America Disability Age 18 to 34 Correlation Chart
The statistical analysis conducted on geographies consisting of 525,628,404 people shows a weak positive correlation between the proportion of Puerto Ricans and percentage of population with a disability between the ages 18 and 35 in the United States with a correlation coefficient (R) of 0.229 and weighted average of 8.0%. Similarly, the statistical analysis conducted on geographies consisting of 554,113,757 people shows a substantial negative correlation between the proportion of Immigrants from Latin America and percentage of population with a disability between the ages 18 and 35 in the United States with a correlation coefficient (R) of -0.522 and weighted average of 6.3%, a difference of 28.0%.
Disability Age 18 to 34 Correlation Summary
| Measurement | Puerto Rican | Immigrants from Latin America |
| Minimum | 3.5% | 0.64% |
| Maximum | 23.4% | 15.8% |
| Range | 19.9% | 15.1% |
| Mean | 9.1% | 5.6% |
| Median | 8.7% | 5.6% |
| Interquartile 25% (IQ1) | 7.1% | 4.4% |
| Interquartile 75% (IQ3) | 10.6% | 6.6% |
| Interquartile Range (IQR) | 3.5% | 2.1% |
| Standard Deviation (Sample) | 3.1% | 1.9% |
| Standard Deviation (Population) | 3.1% | 1.8% |
Similar Demographics by Disability Age 18 to 34
Demographics Similar to Puerto Ricans by Disability Age 18 to 34
In terms of disability age 18 to 34, the demographic groups most similar to Puerto Ricans are American (8.0%, a difference of 0.26%), Hmong (8.1%, a difference of 0.46%), French Canadian (8.1%, a difference of 0.88%), Aleut (8.1%, a difference of 0.93%), and Navajo (8.1%, a difference of 0.97%).
| Demographics | Rating | Rank | Disability Age 18 to 34 |
| Alaska Natives | 0.0 /100 | #309 | Tragic 7.8% |
| Finns | 0.0 /100 | #310 | Tragic 7.8% |
| French | 0.0 /100 | #311 | Tragic 7.9% |
| Spanish Americans | 0.0 /100 | #312 | Tragic 7.9% |
| Iroquois | 0.0 /100 | #313 | Tragic 7.9% |
| Colville | 0.0 /100 | #314 | Tragic 7.9% |
| Americans | 0.0 /100 | #315 | Tragic 8.0% |
| Puerto Ricans | 0.0 /100 | #316 | Tragic 8.0% |
| Hmong | 0.0 /100 | #317 | Tragic 8.1% |
| French Canadians | 0.0 /100 | #318 | Tragic 8.1% |
| Aleuts | 0.0 /100 | #319 | Tragic 8.1% |
| Navajo | 0.0 /100 | #320 | Tragic 8.1% |
| Blackfeet | 0.0 /100 | #321 | Tragic 8.1% |
| Cree | 0.0 /100 | #322 | Tragic 8.1% |
| French American Indians | 0.0 /100 | #323 | Tragic 8.2% |
Demographics Similar to Immigrants from Latin America by Disability Age 18 to 34
In terms of disability age 18 to 34, the demographic groups most similar to Immigrants from Latin America are Immigrants from Romania (6.3%, a difference of 0.0%), Immigrants from France (6.3%, a difference of 0.090%), Immigrants from Brazil (6.3%, a difference of 0.10%), Immigrants from South Eastern Asia (6.3%, a difference of 0.18%), and Sri Lankan (6.2%, a difference of 0.25%).
| Demographics | Rating | Rank | Disability Age 18 to 34 |
| Immigrants | Afghanistan | 95.9 /100 | #106 | Exceptional 6.2% |
| Ethiopians | 95.8 /100 | #107 | Exceptional 6.2% |
| Immigrants | Croatia | 95.7 /100 | #108 | Exceptional 6.2% |
| Sri Lankans | 95.5 /100 | #109 | Exceptional 6.2% |
| Immigrants | Brazil | 95.2 /100 | #110 | Exceptional 6.3% |
| Immigrants | France | 95.1 /100 | #111 | Exceptional 6.3% |
| Immigrants | Romania | 94.9 /100 | #112 | Exceptional 6.3% |
| Immigrants | Latin America | 94.9 /100 | #113 | Exceptional 6.3% |
| Immigrants | South Eastern Asia | 94.4 /100 | #114 | Exceptional 6.3% |
| Koreans | 94.1 /100 | #115 | Exceptional 6.3% |
| Immigrants | Costa Rica | 94.0 /100 | #116 | Exceptional 6.3% |
| Immigrants | Jordan | 94.0 /100 | #117 | Exceptional 6.3% |
| Immigrants | Nepal | 93.7 /100 | #118 | Exceptional 6.3% |
| Chileans | 93.5 /100 | #119 | Exceptional 6.3% |
| Immigrants | Ukraine | 93.4 /100 | #120 | Exceptional 6.3% |