Paraguayan vs Arapaho Disability Age 35 to 64
COMPARE
Paraguayan
Arapaho
Disability Age 35 to 64
Disability Age 35 to 64 Comparison
Paraguayans
Arapaho
9.8%
DISABILITY AGE 35 TO 64
99.8/ 100
METRIC RATING
50th/ 347
METRIC RANK
15.1%
DISABILITY AGE 35 TO 64
0.0/ 100
METRIC RATING
325th/ 347
METRIC RANK
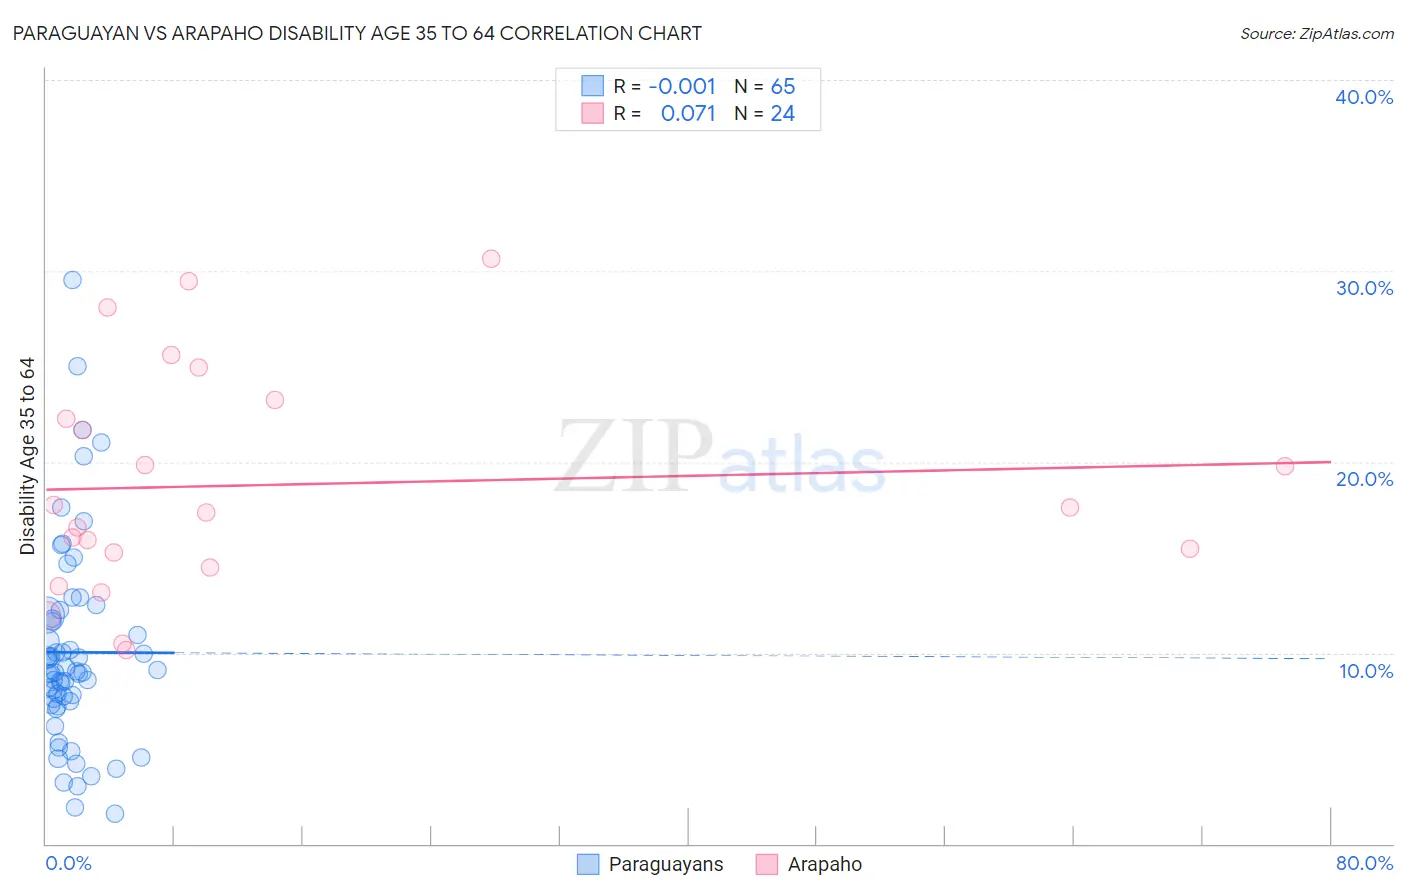
Paraguayan vs Arapaho Disability Age 35 to 64 Correlation Chart
The statistical analysis conducted on geographies consisting of 95,099,439 people shows no correlation between the proportion of Paraguayans and percentage of population with a disability between the ages 34 and 64 in the United States with a correlation coefficient (R) of -0.001 and weighted average of 9.8%. Similarly, the statistical analysis conducted on geographies consisting of 29,778,395 people shows a slight positive correlation between the proportion of Arapaho and percentage of population with a disability between the ages 34 and 64 in the United States with a correlation coefficient (R) of 0.071 and weighted average of 15.1%, a difference of 53.2%.
Disability Age 35 to 64 Correlation Summary
| Measurement | Paraguayan | Arapaho |
| Minimum | 1.6% | 10.2% |
| Maximum | 29.5% | 30.7% |
| Range | 28.0% | 20.5% |
| Mean | 10.0% | 18.8% |
| Median | 9.0% | 17.5% |
| Interquartile 25% (IQ1) | 7.4% | 14.9% |
| Interquartile 75% (IQ3) | 11.9% | 22.7% |
| Interquartile Range (IQR) | 4.5% | 7.9% |
| Standard Deviation (Sample) | 5.3% | 5.8% |
| Standard Deviation (Population) | 5.3% | 5.7% |
Similar Demographics by Disability Age 35 to 64
Demographics Similar to Paraguayans by Disability Age 35 to 64
In terms of disability age 35 to 64, the demographic groups most similar to Paraguayans are Immigrants from Greece (9.8%, a difference of 0.070%), Bhutanese (9.8%, a difference of 0.080%), Immigrants from Bulgaria (9.8%, a difference of 0.10%), Immigrants from Serbia (9.8%, a difference of 0.11%), and Immigrants from Belgium (9.8%, a difference of 0.12%).
| Demographics | Rating | Rank | Disability Age 35 to 64 |
| Immigrants | Colombia | 99.9 /100 | #43 | Exceptional 9.8% |
| Immigrants | Egypt | 99.9 /100 | #44 | Exceptional 9.8% |
| Immigrants | Peru | 99.9 /100 | #45 | Exceptional 9.8% |
| Cambodians | 99.8 /100 | #46 | Exceptional 9.8% |
| Immigrants | Belgium | 99.8 /100 | #47 | Exceptional 9.8% |
| Immigrants | Serbia | 99.8 /100 | #48 | Exceptional 9.8% |
| Immigrants | Greece | 99.8 /100 | #49 | Exceptional 9.8% |
| Paraguayans | 99.8 /100 | #50 | Exceptional 9.8% |
| Bhutanese | 99.8 /100 | #51 | Exceptional 9.8% |
| Immigrants | Bulgaria | 99.8 /100 | #52 | Exceptional 9.8% |
| Taiwanese | 99.8 /100 | #53 | Exceptional 9.8% |
| Immigrants | Russia | 99.8 /100 | #54 | Exceptional 9.8% |
| Peruvians | 99.8 /100 | #55 | Exceptional 9.9% |
| South Americans | 99.8 /100 | #56 | Exceptional 9.9% |
| Colombians | 99.8 /100 | #57 | Exceptional 9.9% |
Demographics Similar to Arapaho by Disability Age 35 to 64
In terms of disability age 35 to 64, the demographic groups most similar to Arapaho are Chippewa (15.0%, a difference of 0.66%), Apache (14.9%, a difference of 0.87%), Native/Alaskan (15.3%, a difference of 1.6%), Pueblo (15.3%, a difference of 1.7%), and Cajun (15.3%, a difference of 1.8%).
| Demographics | Rating | Rank | Disability Age 35 to 64 |
| Ottawa | 0.0 /100 | #318 | Tragic 14.6% |
| Immigrants | Cabo Verde | 0.0 /100 | #319 | Tragic 14.7% |
| Blacks/African Americans | 0.0 /100 | #320 | Tragic 14.7% |
| Comanche | 0.0 /100 | #321 | Tragic 14.7% |
| Potawatomi | 0.0 /100 | #322 | Tragic 14.8% |
| Apache | 0.0 /100 | #323 | Tragic 14.9% |
| Chippewa | 0.0 /100 | #324 | Tragic 15.0% |
| Arapaho | 0.0 /100 | #325 | Tragic 15.1% |
| Natives/Alaskans | 0.0 /100 | #326 | Tragic 15.3% |
| Pueblo | 0.0 /100 | #327 | Tragic 15.3% |
| Cajuns | 0.0 /100 | #328 | Tragic 15.3% |
| Cherokee | 0.0 /100 | #329 | Tragic 15.5% |
| Navajo | 0.0 /100 | #330 | Tragic 15.5% |
| Dutch West Indians | 0.0 /100 | #331 | Tragic 15.6% |
| Alaskan Athabascans | 0.0 /100 | #332 | Tragic 15.7% |