Palestinian vs Immigrants from Uruguay Disability Age 65 to 74
COMPARE
Palestinian
Immigrants from Uruguay
Disability Age 65 to 74
Disability Age 65 to 74 Comparison
Palestinians
Immigrants from Uruguay
22.2%
DISABILITY AGE 65 TO 74
96.3/ 100
METRIC RATING
105th/ 347
METRIC RANK
22.6%
DISABILITY AGE 65 TO 74
90.1/ 100
METRIC RATING
129th/ 347
METRIC RANK
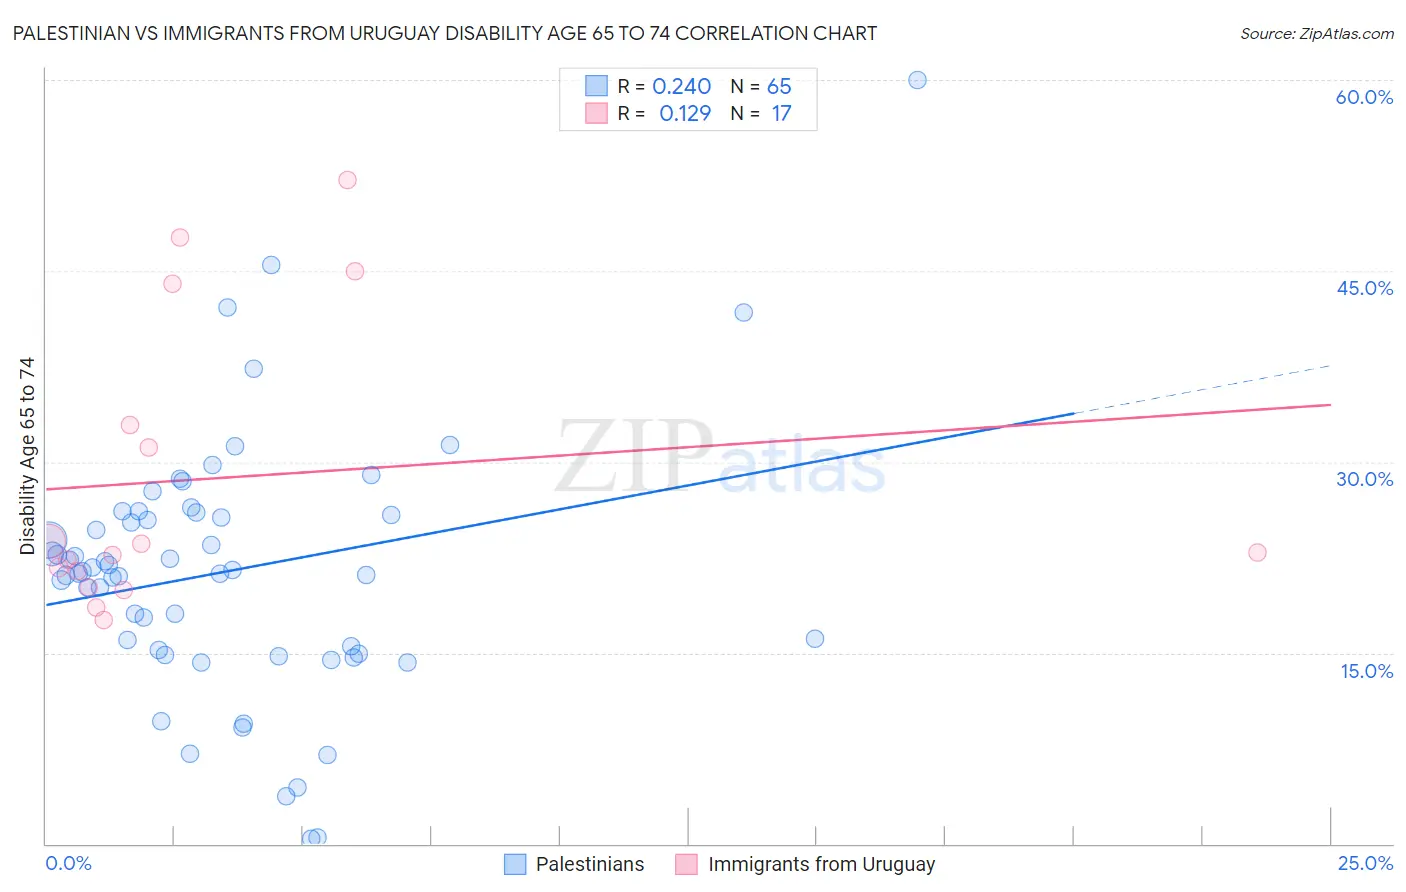
Palestinian vs Immigrants from Uruguay Disability Age 65 to 74 Correlation Chart
The statistical analysis conducted on geographies consisting of 216,253,124 people shows a weak positive correlation between the proportion of Palestinians and percentage of population with a disability between the ages 65 and 75 in the United States with a correlation coefficient (R) of 0.240 and weighted average of 22.2%. Similarly, the statistical analysis conducted on geographies consisting of 133,228,680 people shows a poor positive correlation between the proportion of Immigrants from Uruguay and percentage of population with a disability between the ages 65 and 75 in the United States with a correlation coefficient (R) of 0.129 and weighted average of 22.6%, a difference of 1.6%.
Disability Age 65 to 74 Correlation Summary
| Measurement | Palestinian | Immigrants from Uruguay |
| Minimum | 0.44% | 17.5% |
| Maximum | 60.0% | 52.1% |
| Range | 59.6% | 34.6% |
| Mean | 21.4% | 28.7% |
| Median | 21.4% | 22.9% |
| Interquartile 25% (IQ1) | 15.0% | 20.8% |
| Interquartile 75% (IQ3) | 25.9% | 38.5% |
| Interquartile Range (IQR) | 10.9% | 17.7% |
| Standard Deviation (Sample) | 10.2% | 11.4% |
| Standard Deviation (Population) | 10.1% | 11.0% |
Similar Demographics by Disability Age 65 to 74
Demographics Similar to Palestinians by Disability Age 65 to 74
In terms of disability age 65 to 74, the demographic groups most similar to Palestinians are Colombian (22.2%, a difference of 0.040%), South American (22.2%, a difference of 0.050%), Peruvian (22.2%, a difference of 0.060%), Slovene (22.2%, a difference of 0.070%), and Immigrants from Saudi Arabia (22.2%, a difference of 0.080%).
| Demographics | Rating | Rank | Disability Age 65 to 74 |
| Jordanians | 96.9 /100 | #98 | Exceptional 22.2% |
| Immigrants | Colombia | 96.8 /100 | #99 | Exceptional 22.2% |
| Uruguayans | 96.5 /100 | #100 | Exceptional 22.2% |
| Immigrants | England | 96.5 /100 | #101 | Exceptional 22.2% |
| Immigrants | Saudi Arabia | 96.4 /100 | #102 | Exceptional 22.2% |
| South Americans | 96.4 /100 | #103 | Exceptional 22.2% |
| Colombians | 96.4 /100 | #104 | Exceptional 22.2% |
| Palestinians | 96.3 /100 | #105 | Exceptional 22.2% |
| Peruvians | 96.1 /100 | #106 | Exceptional 22.2% |
| Slovenes | 96.1 /100 | #107 | Exceptional 22.2% |
| Immigrants | Zimbabwe | 96.1 /100 | #108 | Exceptional 22.3% |
| Albanians | 95.8 /100 | #109 | Exceptional 22.3% |
| Immigrants | Peru | 95.7 /100 | #110 | Exceptional 22.3% |
| Serbians | 95.7 /100 | #111 | Exceptional 22.3% |
| Immigrants | South America | 95.5 /100 | #112 | Exceptional 22.3% |
Demographics Similar to Immigrants from Uruguay by Disability Age 65 to 74
In terms of disability age 65 to 74, the demographic groups most similar to Immigrants from Uruguay are Immigrants from Albania (22.6%, a difference of 0.010%), Immigrants from Costa Rica (22.6%, a difference of 0.060%), Immigrants from Nepal (22.6%, a difference of 0.10%), Costa Rican (22.6%, a difference of 0.14%), and Northern European (22.6%, a difference of 0.18%).
| Demographics | Rating | Rank | Disability Age 65 to 74 |
| Immigrants | Jordan | 93.5 /100 | #122 | Exceptional 22.4% |
| Hungarians | 93.3 /100 | #123 | Exceptional 22.4% |
| Norwegians | 92.5 /100 | #124 | Exceptional 22.5% |
| Immigrants | Western Europe | 92.3 /100 | #125 | Exceptional 22.5% |
| Lebanese | 92.2 /100 | #126 | Exceptional 22.5% |
| Slovaks | 91.6 /100 | #127 | Exceptional 22.5% |
| Immigrants | Costa Rica | 90.4 /100 | #128 | Exceptional 22.6% |
| Immigrants | Uruguay | 90.1 /100 | #129 | Exceptional 22.6% |
| Immigrants | Albania | 90.0 /100 | #130 | Excellent 22.6% |
| Immigrants | Nepal | 89.4 /100 | #131 | Excellent 22.6% |
| Costa Ricans | 89.2 /100 | #132 | Excellent 22.6% |
| Northern Europeans | 88.9 /100 | #133 | Excellent 22.6% |
| Afghans | 88.6 /100 | #134 | Excellent 22.6% |
| Immigrants | Ukraine | 88.4 /100 | #135 | Excellent 22.6% |
| Ethiopians | 87.9 /100 | #136 | Excellent 22.7% |