Paiute vs Native Hawaiian Disability Age 65 to 74
COMPARE
Paiute
Native Hawaiian
Disability Age 65 to 74
Disability Age 65 to 74 Comparison
Paiute
Native Hawaiians
27.8%
DISABILITY AGE 65 TO 74
0.0/ 100
METRIC RATING
313th/ 347
METRIC RANK
24.1%
DISABILITY AGE 65 TO 74
9.3/ 100
METRIC RATING
222nd/ 347
METRIC RANK
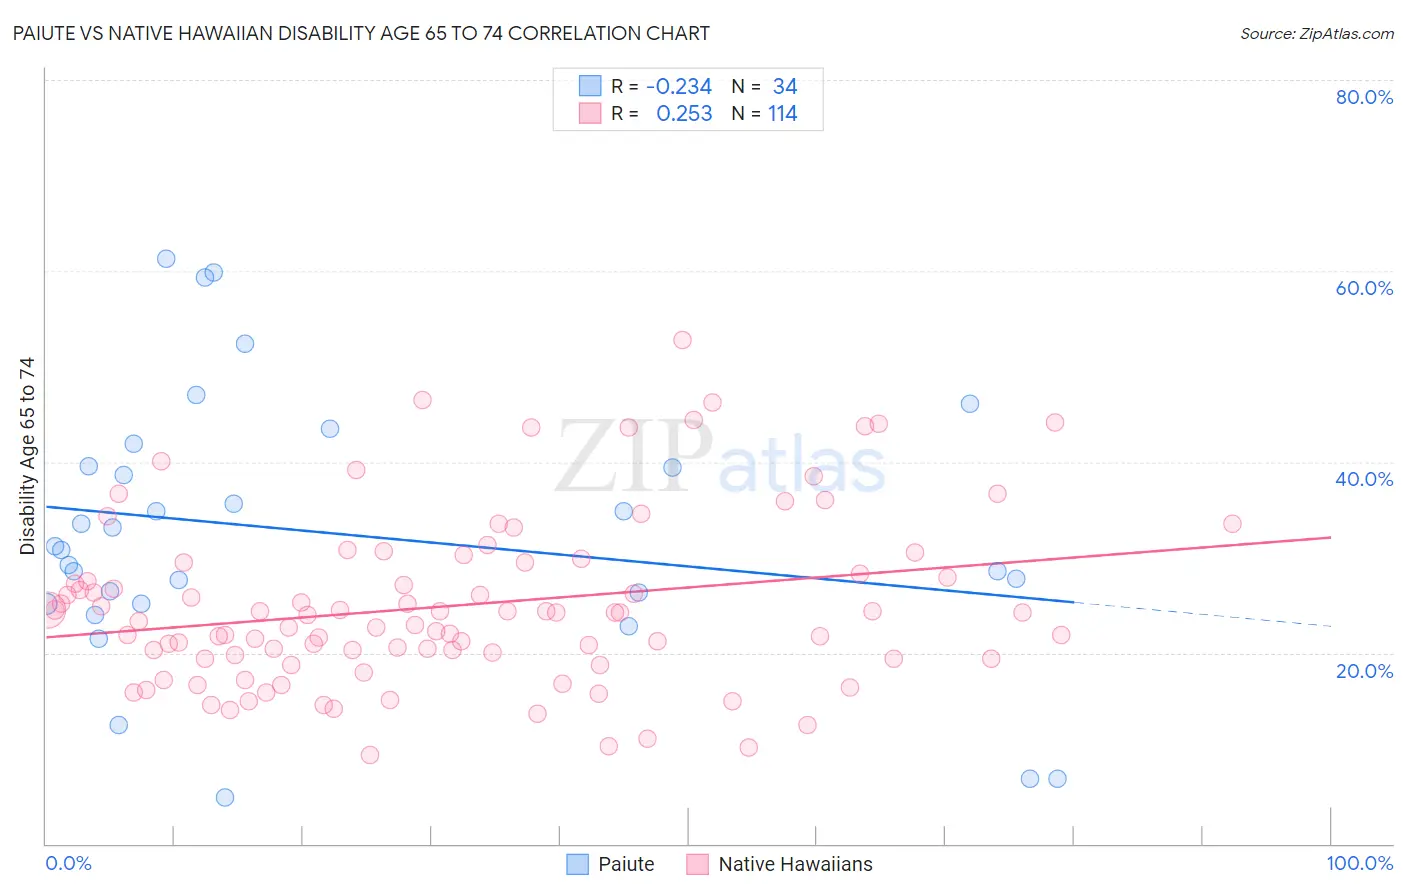
Paiute vs Native Hawaiian Disability Age 65 to 74 Correlation Chart
The statistical analysis conducted on geographies consisting of 58,387,848 people shows a weak negative correlation between the proportion of Paiute and percentage of population with a disability between the ages 65 and 75 in the United States with a correlation coefficient (R) of -0.234 and weighted average of 27.8%. Similarly, the statistical analysis conducted on geographies consisting of 331,315,528 people shows a weak positive correlation between the proportion of Native Hawaiians and percentage of population with a disability between the ages 65 and 75 in the United States with a correlation coefficient (R) of 0.253 and weighted average of 24.1%, a difference of 15.3%.
Disability Age 65 to 74 Correlation Summary
| Measurement | Paiute | Native Hawaiian |
| Minimum | 4.8% | 9.2% |
| Maximum | 61.3% | 52.7% |
| Range | 56.4% | 43.5% |
| Mean | 32.6% | 24.9% |
| Median | 31.0% | 24.1% |
| Interquartile 25% (IQ1) | 25.2% | 19.4% |
| Interquartile 75% (IQ3) | 39.5% | 29.5% |
| Interquartile Range (IQR) | 14.3% | 10.1% |
| Standard Deviation (Sample) | 14.0% | 8.9% |
| Standard Deviation (Population) | 13.8% | 8.8% |
Similar Demographics by Disability Age 65 to 74
Demographics Similar to Paiute by Disability Age 65 to 74
In terms of disability age 65 to 74, the demographic groups most similar to Paiute are Chippewa (27.8%, a difference of 0.010%), Cajun (27.9%, a difference of 0.48%), Crow (27.9%, a difference of 0.53%), Immigrants from Armenia (28.0%, a difference of 0.62%), and Nepalese (28.0%, a difference of 0.84%).
| Demographics | Rating | Rank | Disability Age 65 to 74 |
| Blacks/African Americans | 0.0 /100 | #306 | Tragic 27.3% |
| Ute | 0.0 /100 | #307 | Tragic 27.3% |
| Sioux | 0.0 /100 | #308 | Tragic 27.3% |
| Yaqui | 0.0 /100 | #309 | Tragic 27.4% |
| Shoshone | 0.0 /100 | #310 | Tragic 27.4% |
| Menominee | 0.0 /100 | #311 | Tragic 27.4% |
| Osage | 0.0 /100 | #312 | Tragic 27.5% |
| Paiute | 0.0 /100 | #313 | Tragic 27.8% |
| Chippewa | 0.0 /100 | #314 | Tragic 27.8% |
| Cajuns | 0.0 /100 | #315 | Tragic 27.9% |
| Crow | 0.0 /100 | #316 | Tragic 27.9% |
| Immigrants | Armenia | 0.0 /100 | #317 | Tragic 28.0% |
| Nepalese | 0.0 /100 | #318 | Tragic 28.0% |
| Arapaho | 0.0 /100 | #319 | Tragic 28.1% |
| Cherokee | 0.0 /100 | #320 | Tragic 28.2% |
Demographics Similar to Native Hawaiians by Disability Age 65 to 74
In terms of disability age 65 to 74, the demographic groups most similar to Native Hawaiians are Immigrants from Nicaragua (24.1%, a difference of 0.070%), Immigrants from Middle Africa (24.1%, a difference of 0.070%), Immigrants from Panama (24.1%, a difference of 0.12%), Ghanaian (24.1%, a difference of 0.16%), and Bermudan (24.2%, a difference of 0.20%).
| Demographics | Rating | Rank | Disability Age 65 to 74 |
| Pennsylvania Germans | 13.3 /100 | #215 | Poor 24.0% |
| Jamaicans | 12.2 /100 | #216 | Poor 24.0% |
| Immigrants | Portugal | 11.7 /100 | #217 | Poor 24.0% |
| Immigrants | Nigeria | 11.7 /100 | #218 | Poor 24.0% |
| Immigrants | Burma/Myanmar | 11.6 /100 | #219 | Poor 24.0% |
| Ghanaians | 10.4 /100 | #220 | Poor 24.1% |
| Immigrants | Nicaragua | 9.8 /100 | #221 | Tragic 24.1% |
| Native Hawaiians | 9.3 /100 | #222 | Tragic 24.1% |
| Immigrants | Middle Africa | 8.9 /100 | #223 | Tragic 24.1% |
| Immigrants | Panama | 8.6 /100 | #224 | Tragic 24.1% |
| Bermudans | 8.2 /100 | #225 | Tragic 24.2% |
| Iraqis | 8.1 /100 | #226 | Tragic 24.2% |
| Nigerians | 7.8 /100 | #227 | Tragic 24.2% |
| Whites/Caucasians | 6.6 /100 | #228 | Tragic 24.2% |
| Celtics | 6.4 /100 | #229 | Tragic 24.2% |