Okinawan vs Iranian Disability Age 65 to 74
COMPARE
Okinawan
Iranian
Disability Age 65 to 74
Disability Age 65 to 74 Comparison
Okinawans
Iranians
20.7%
DISABILITY AGE 65 TO 74
100.0/ 100
METRIC RATING
20th/ 347
METRIC RANK
19.9%
DISABILITY AGE 65 TO 74
100.0/ 100
METRIC RATING
6th/ 347
METRIC RANK
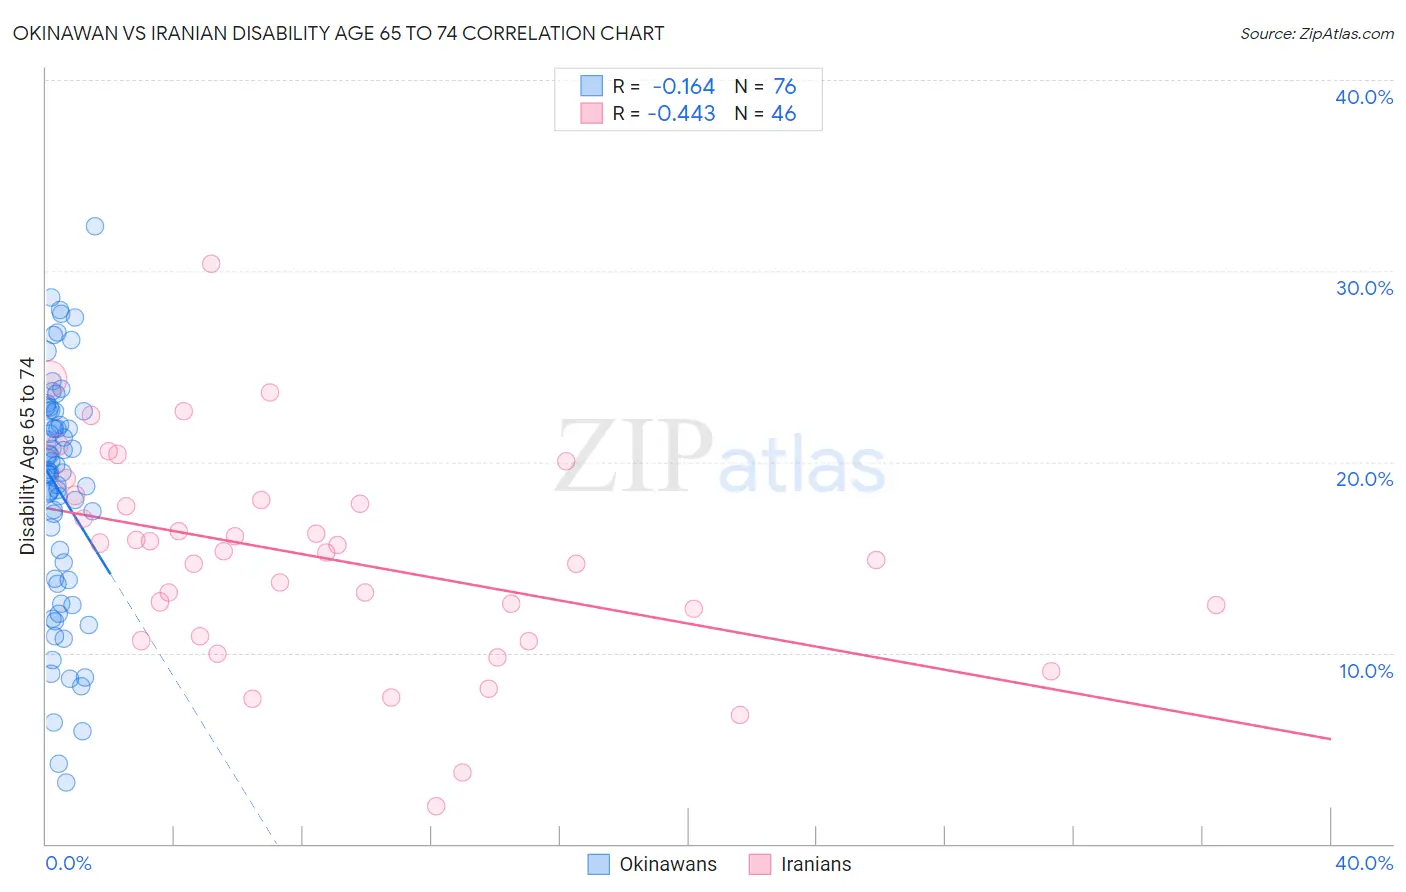
Okinawan vs Iranian Disability Age 65 to 74 Correlation Chart
The statistical analysis conducted on geographies consisting of 73,634,588 people shows a poor negative correlation between the proportion of Okinawans and percentage of population with a disability between the ages 65 and 75 in the United States with a correlation coefficient (R) of -0.164 and weighted average of 20.7%. Similarly, the statistical analysis conducted on geographies consisting of 316,255,401 people shows a moderate negative correlation between the proportion of Iranians and percentage of population with a disability between the ages 65 and 75 in the United States with a correlation coefficient (R) of -0.443 and weighted average of 19.9%, a difference of 3.8%.
Disability Age 65 to 74 Correlation Summary
| Measurement | Okinawan | Iranian |
| Minimum | 3.2% | 2.0% |
| Maximum | 32.4% | 30.4% |
| Range | 29.1% | 28.4% |
| Mean | 18.4% | 14.9% |
| Median | 19.5% | 15.3% |
| Interquartile 25% (IQ1) | 13.8% | 10.9% |
| Interquartile 75% (IQ3) | 22.7% | 18.0% |
| Interquartile Range (IQR) | 8.8% | 7.1% |
| Standard Deviation (Sample) | 6.2% | 5.6% |
| Standard Deviation (Population) | 6.1% | 5.5% |
Demographics Similar to Okinawans and Iranians by Disability Age 65 to 74
In terms of disability age 65 to 74, the demographic groups most similar to Okinawans are Burmese (20.6%, a difference of 0.32%), Eastern European (20.6%, a difference of 0.35%), Immigrants from South Central Asia (20.6%, a difference of 0.42%), Immigrants from Lithuania (20.5%, a difference of 0.67%), and Paraguayan (20.5%, a difference of 0.73%). Similarly, the demographic groups most similar to Iranians are Immigrants from Israel (19.9%, a difference of 0.11%), Immigrants from Hong Kong (19.9%, a difference of 0.41%), Cypriot (20.1%, a difference of 0.67%), Thai (20.1%, a difference of 0.70%), and Immigrants from India (19.7%, a difference of 1.3%).
| Demographics | Rating | Rank | Disability Age 65 to 74 |
| Immigrants | India | 100.0 /100 | #3 | Exceptional 19.7% |
| Immigrants | Hong Kong | 100.0 /100 | #4 | Exceptional 19.9% |
| Immigrants | Israel | 100.0 /100 | #5 | Exceptional 19.9% |
| Iranians | 100.0 /100 | #6 | Exceptional 19.9% |
| Cypriots | 100.0 /100 | #7 | Exceptional 20.1% |
| Thais | 100.0 /100 | #8 | Exceptional 20.1% |
| Immigrants | China | 100.0 /100 | #9 | Exceptional 20.3% |
| Immigrants | Eastern Asia | 100.0 /100 | #10 | Exceptional 20.3% |
| Immigrants | Ireland | 100.0 /100 | #11 | Exceptional 20.3% |
| Immigrants | Korea | 100.0 /100 | #12 | Exceptional 20.4% |
| Immigrants | Singapore | 100.0 /100 | #13 | Exceptional 20.4% |
| Indians (Asian) | 100.0 /100 | #14 | Exceptional 20.5% |
| Paraguayans | 100.0 /100 | #15 | Exceptional 20.5% |
| Immigrants | Lithuania | 100.0 /100 | #16 | Exceptional 20.5% |
| Immigrants | South Central Asia | 100.0 /100 | #17 | Exceptional 20.6% |
| Eastern Europeans | 100.0 /100 | #18 | Exceptional 20.6% |
| Burmese | 100.0 /100 | #19 | Exceptional 20.6% |
| Okinawans | 100.0 /100 | #20 | Exceptional 20.7% |
| Immigrants | Bolivia | 99.9 /100 | #21 | Exceptional 20.8% |
| Immigrants | Iran | 99.9 /100 | #22 | Exceptional 20.9% |
| Immigrants | Belgium | 99.9 /100 | #23 | Exceptional 21.0% |