Native Hawaiian vs Aleut Disability Age 65 to 74
COMPARE
Native Hawaiian
Aleut
Disability Age 65 to 74
Disability Age 65 to 74 Comparison
Native Hawaiians
Aleuts
24.1%
DISABILITY AGE 65 TO 74
9.3/ 100
METRIC RATING
222nd/ 347
METRIC RANK
28.4%
DISABILITY AGE 65 TO 74
0.0/ 100
METRIC RATING
322nd/ 347
METRIC RANK
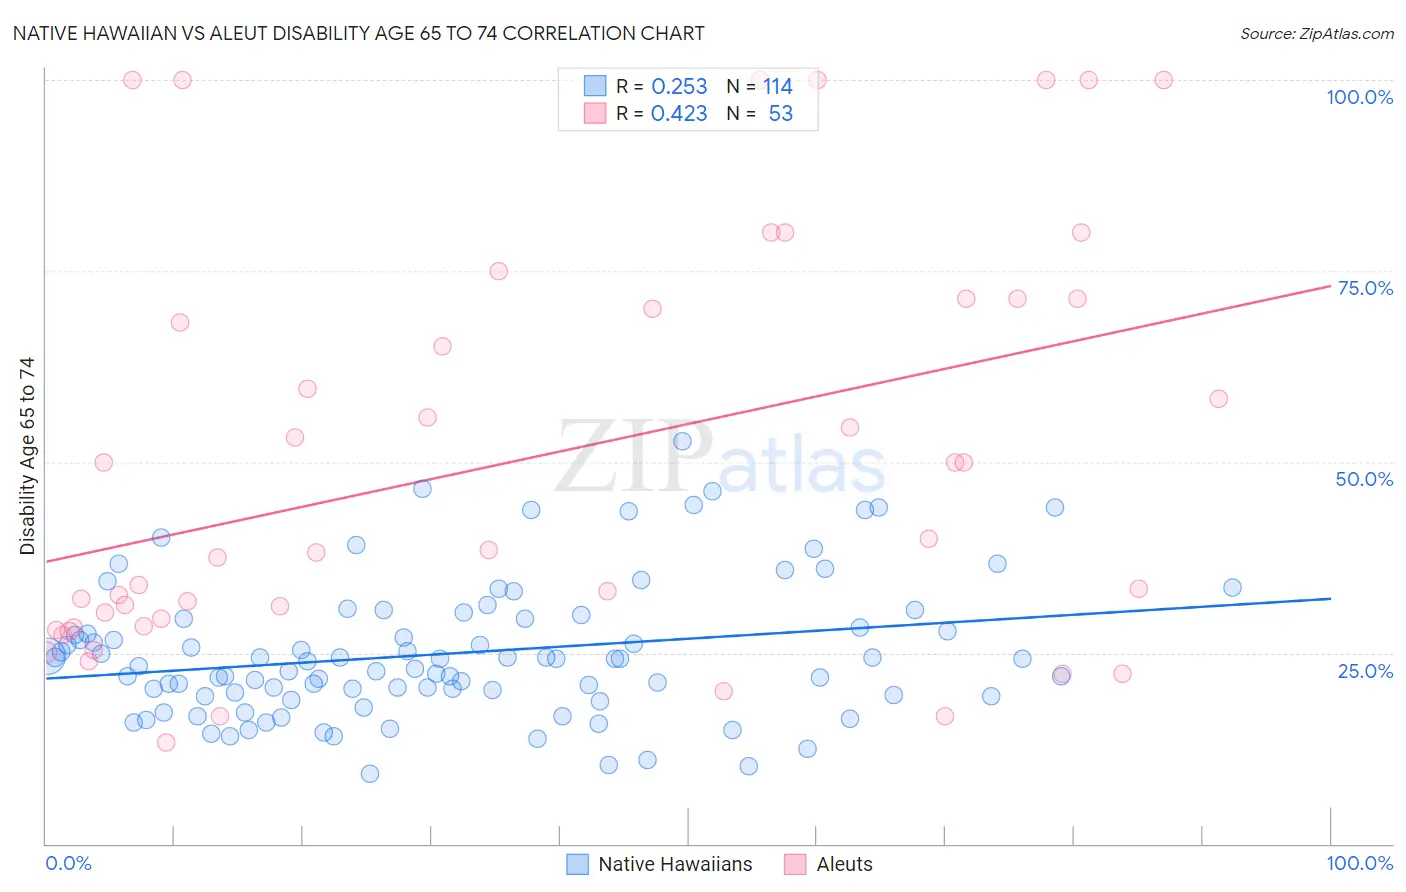
Native Hawaiian vs Aleut Disability Age 65 to 74 Correlation Chart
The statistical analysis conducted on geographies consisting of 331,315,528 people shows a weak positive correlation between the proportion of Native Hawaiians and percentage of population with a disability between the ages 65 and 75 in the United States with a correlation coefficient (R) of 0.253 and weighted average of 24.1%. Similarly, the statistical analysis conducted on geographies consisting of 61,757,238 people shows a moderate positive correlation between the proportion of Aleuts and percentage of population with a disability between the ages 65 and 75 in the United States with a correlation coefficient (R) of 0.423 and weighted average of 28.4%, a difference of 17.9%.
Disability Age 65 to 74 Correlation Summary
| Measurement | Native Hawaiian | Aleut |
| Minimum | 9.2% | 13.2% |
| Maximum | 52.7% | 100.0% |
| Range | 43.5% | 86.8% |
| Mean | 24.9% | 50.2% |
| Median | 24.1% | 38.5% |
| Interquartile 25% (IQ1) | 19.4% | 28.4% |
| Interquartile 75% (IQ3) | 29.5% | 71.4% |
| Interquartile Range (IQR) | 10.1% | 43.0% |
| Standard Deviation (Sample) | 8.9% | 26.9% |
| Standard Deviation (Population) | 8.8% | 26.6% |
Similar Demographics by Disability Age 65 to 74
Demographics Similar to Native Hawaiians by Disability Age 65 to 74
In terms of disability age 65 to 74, the demographic groups most similar to Native Hawaiians are Immigrants from Nicaragua (24.1%, a difference of 0.070%), Immigrants from Middle Africa (24.1%, a difference of 0.070%), Immigrants from Panama (24.1%, a difference of 0.12%), Ghanaian (24.1%, a difference of 0.16%), and Bermudan (24.2%, a difference of 0.20%).
| Demographics | Rating | Rank | Disability Age 65 to 74 |
| Pennsylvania Germans | 13.3 /100 | #215 | Poor 24.0% |
| Jamaicans | 12.2 /100 | #216 | Poor 24.0% |
| Immigrants | Portugal | 11.7 /100 | #217 | Poor 24.0% |
| Immigrants | Nigeria | 11.7 /100 | #218 | Poor 24.0% |
| Immigrants | Burma/Myanmar | 11.6 /100 | #219 | Poor 24.0% |
| Ghanaians | 10.4 /100 | #220 | Poor 24.1% |
| Immigrants | Nicaragua | 9.8 /100 | #221 | Tragic 24.1% |
| Native Hawaiians | 9.3 /100 | #222 | Tragic 24.1% |
| Immigrants | Middle Africa | 8.9 /100 | #223 | Tragic 24.1% |
| Immigrants | Panama | 8.6 /100 | #224 | Tragic 24.1% |
| Bermudans | 8.2 /100 | #225 | Tragic 24.2% |
| Iraqis | 8.1 /100 | #226 | Tragic 24.2% |
| Nigerians | 7.8 /100 | #227 | Tragic 24.2% |
| Whites/Caucasians | 6.6 /100 | #228 | Tragic 24.2% |
| Celtics | 6.4 /100 | #229 | Tragic 24.2% |
Demographics Similar to Aleuts by Disability Age 65 to 74
In terms of disability age 65 to 74, the demographic groups most similar to Aleuts are Comanche (28.3%, a difference of 0.33%), Cherokee (28.2%, a difference of 0.84%), Arapaho (28.1%, a difference of 1.2%), Nepalese (28.0%, a difference of 1.5%), and Immigrants from Armenia (28.0%, a difference of 1.7%).
| Demographics | Rating | Rank | Disability Age 65 to 74 |
| Cajuns | 0.0 /100 | #315 | Tragic 27.9% |
| Crow | 0.0 /100 | #316 | Tragic 27.9% |
| Immigrants | Armenia | 0.0 /100 | #317 | Tragic 28.0% |
| Nepalese | 0.0 /100 | #318 | Tragic 28.0% |
| Arapaho | 0.0 /100 | #319 | Tragic 28.1% |
| Cherokee | 0.0 /100 | #320 | Tragic 28.2% |
| Comanche | 0.0 /100 | #321 | Tragic 28.3% |
| Aleuts | 0.0 /100 | #322 | Tragic 28.4% |
| Puerto Ricans | 0.0 /100 | #323 | Tragic 29.1% |
| Seminole | 0.0 /100 | #324 | Tragic 29.4% |
| Dutch West Indians | 0.0 /100 | #325 | Tragic 29.6% |
| Yakama | 0.0 /100 | #326 | Tragic 29.6% |
| Apache | 0.0 /100 | #327 | Tragic 29.7% |
| Hopi | 0.0 /100 | #328 | Tragic 30.0% |
| Choctaw | 0.0 /100 | #329 | Tragic 30.2% |