Moroccan vs Immigrants from Ukraine Disability Age 18 to 34
COMPARE
Moroccan
Immigrants from Ukraine
Disability Age 18 to 34
Disability Age 18 to 34 Comparison
Moroccans
Immigrants from Ukraine
6.4%
DISABILITY AGE 18 TO 34
85.2/ 100
METRIC RATING
145th/ 347
METRIC RANK
6.3%
DISABILITY AGE 18 TO 34
93.4/ 100
METRIC RATING
120th/ 347
METRIC RANK
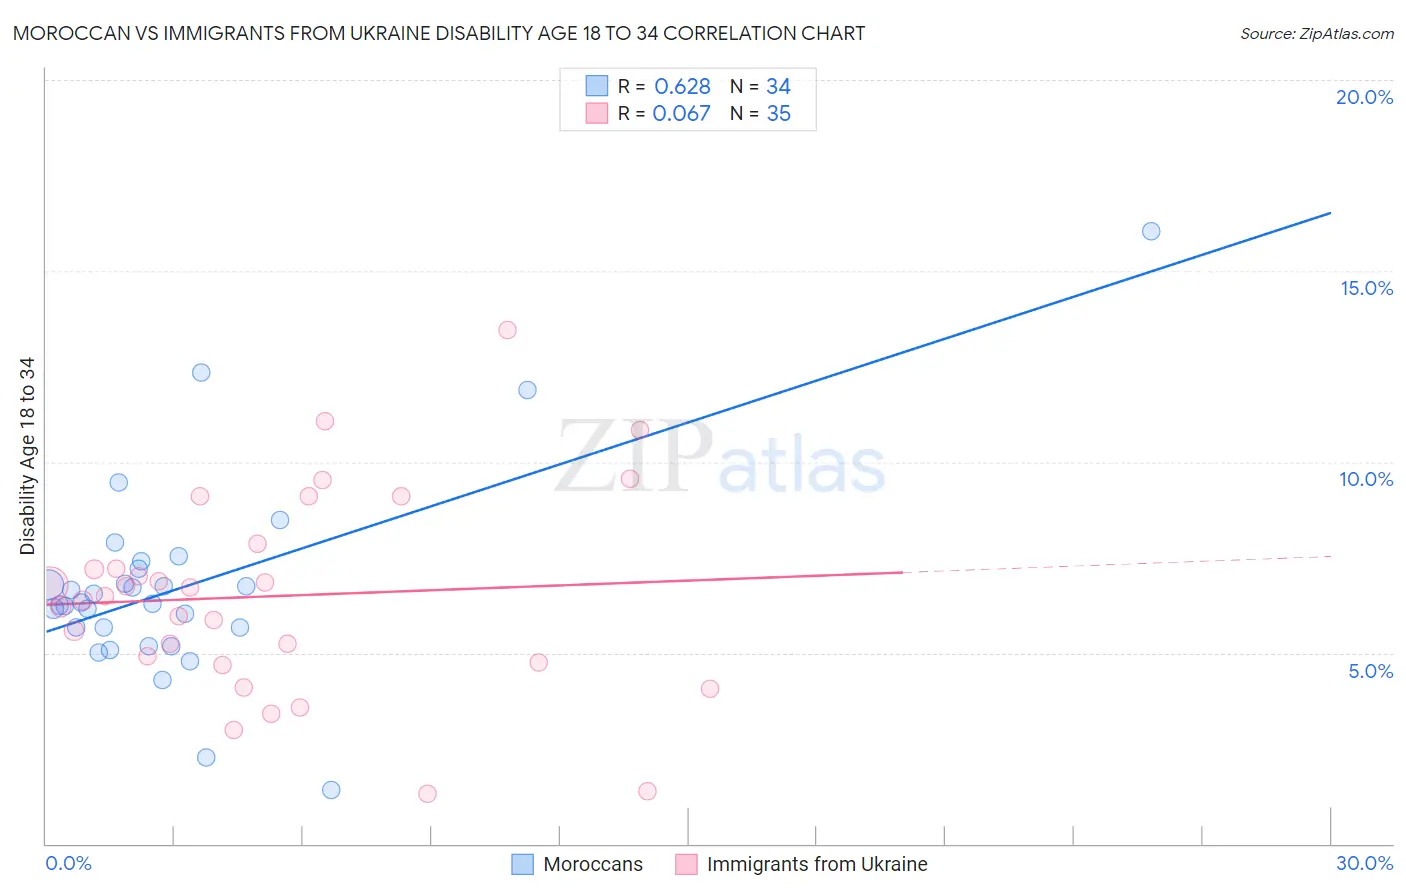
Moroccan vs Immigrants from Ukraine Disability Age 18 to 34 Correlation Chart
The statistical analysis conducted on geographies consisting of 201,641,567 people shows a significant positive correlation between the proportion of Moroccans and percentage of population with a disability between the ages 18 and 35 in the United States with a correlation coefficient (R) of 0.628 and weighted average of 6.4%. Similarly, the statistical analysis conducted on geographies consisting of 289,200,825 people shows a slight positive correlation between the proportion of Immigrants from Ukraine and percentage of population with a disability between the ages 18 and 35 in the United States with a correlation coefficient (R) of 0.067 and weighted average of 6.3%, a difference of 1.6%.
Disability Age 18 to 34 Correlation Summary
| Measurement | Moroccan | Immigrants from Ukraine |
| Minimum | 1.4% | 1.3% |
| Maximum | 16.0% | 13.5% |
| Range | 14.6% | 12.2% |
| Mean | 6.7% | 6.5% |
| Median | 6.3% | 6.5% |
| Interquartile 25% (IQ1) | 5.7% | 4.8% |
| Interquartile 75% (IQ3) | 7.2% | 7.9% |
| Interquartile Range (IQR) | 1.5% | 3.1% |
| Standard Deviation (Sample) | 2.6% | 2.7% |
| Standard Deviation (Population) | 2.6% | 2.6% |
Similar Demographics by Disability Age 18 to 34
Demographics Similar to Moroccans by Disability Age 18 to 34
In terms of disability age 18 to 34, the demographic groups most similar to Moroccans are Albanian (6.4%, a difference of 0.0%), Belizean (6.4%, a difference of 0.050%), Immigrants from Latvia (6.4%, a difference of 0.17%), South American Indian (6.4%, a difference of 0.19%), and Immigrants from South Africa (6.4%, a difference of 0.21%).
| Demographics | Rating | Rank | Disability Age 18 to 34 |
| Spanish American Indians | 87.7 /100 | #138 | Excellent 6.4% |
| Immigrants | Belize | 87.4 /100 | #139 | Excellent 6.4% |
| Immigrants | Fiji | 87.3 /100 | #140 | Excellent 6.4% |
| Jamaicans | 86.8 /100 | #141 | Excellent 6.4% |
| South American Indians | 86.5 /100 | #142 | Excellent 6.4% |
| Immigrants | Latvia | 86.4 /100 | #143 | Excellent 6.4% |
| Albanians | 85.3 /100 | #144 | Excellent 6.4% |
| Moroccans | 85.2 /100 | #145 | Excellent 6.4% |
| Belizeans | 84.9 /100 | #146 | Excellent 6.4% |
| Immigrants | South Africa | 83.7 /100 | #147 | Excellent 6.4% |
| Immigrants | Belgium | 83.5 /100 | #148 | Excellent 6.4% |
| Hondurans | 83.1 /100 | #149 | Excellent 6.4% |
| Immigrants | Dominican Republic | 82.7 /100 | #150 | Excellent 6.4% |
| Tongans | 81.9 /100 | #151 | Excellent 6.4% |
| Bulgarians | 78.3 /100 | #152 | Good 6.5% |
Demographics Similar to Immigrants from Ukraine by Disability Age 18 to 34
In terms of disability age 18 to 34, the demographic groups most similar to Immigrants from Ukraine are Immigrants from Guatemala (6.3%, a difference of 0.0%), Immigrants from Czechoslovakia (6.3%, a difference of 0.020%), Chilean (6.3%, a difference of 0.030%), Immigrants from Nepal (6.3%, a difference of 0.080%), and Costa Rican (6.3%, a difference of 0.13%).
| Demographics | Rating | Rank | Disability Age 18 to 34 |
| Immigrants | Latin America | 94.9 /100 | #113 | Exceptional 6.3% |
| Immigrants | South Eastern Asia | 94.4 /100 | #114 | Exceptional 6.3% |
| Koreans | 94.1 /100 | #115 | Exceptional 6.3% |
| Immigrants | Costa Rica | 94.0 /100 | #116 | Exceptional 6.3% |
| Immigrants | Jordan | 94.0 /100 | #117 | Exceptional 6.3% |
| Immigrants | Nepal | 93.7 /100 | #118 | Exceptional 6.3% |
| Chileans | 93.5 /100 | #119 | Exceptional 6.3% |
| Immigrants | Ukraine | 93.4 /100 | #120 | Exceptional 6.3% |
| Immigrants | Guatemala | 93.4 /100 | #121 | Exceptional 6.3% |
| Immigrants | Czechoslovakia | 93.3 /100 | #122 | Exceptional 6.3% |
| Costa Ricans | 92.9 /100 | #123 | Exceptional 6.3% |
| Immigrants | Morocco | 92.9 /100 | #124 | Exceptional 6.3% |
| Macedonians | 92.6 /100 | #125 | Exceptional 6.3% |
| Immigrants | Switzerland | 92.5 /100 | #126 | Exceptional 6.3% |
| West Indians | 92.0 /100 | #127 | Exceptional 6.3% |