Marshallese vs Greek Disability Age Over 75
COMPARE
Marshallese
Greek
Disability Age Over 75
Disability Age Over 75 Comparison
Marshallese
Greeks
50.1%
DISABILITY AGE OVER 75
0.0/ 100
METRIC RATING
298th/ 347
METRIC RANK
45.6%
DISABILITY AGE OVER 75
99.8/ 100
METRIC RATING
42nd/ 347
METRIC RANK
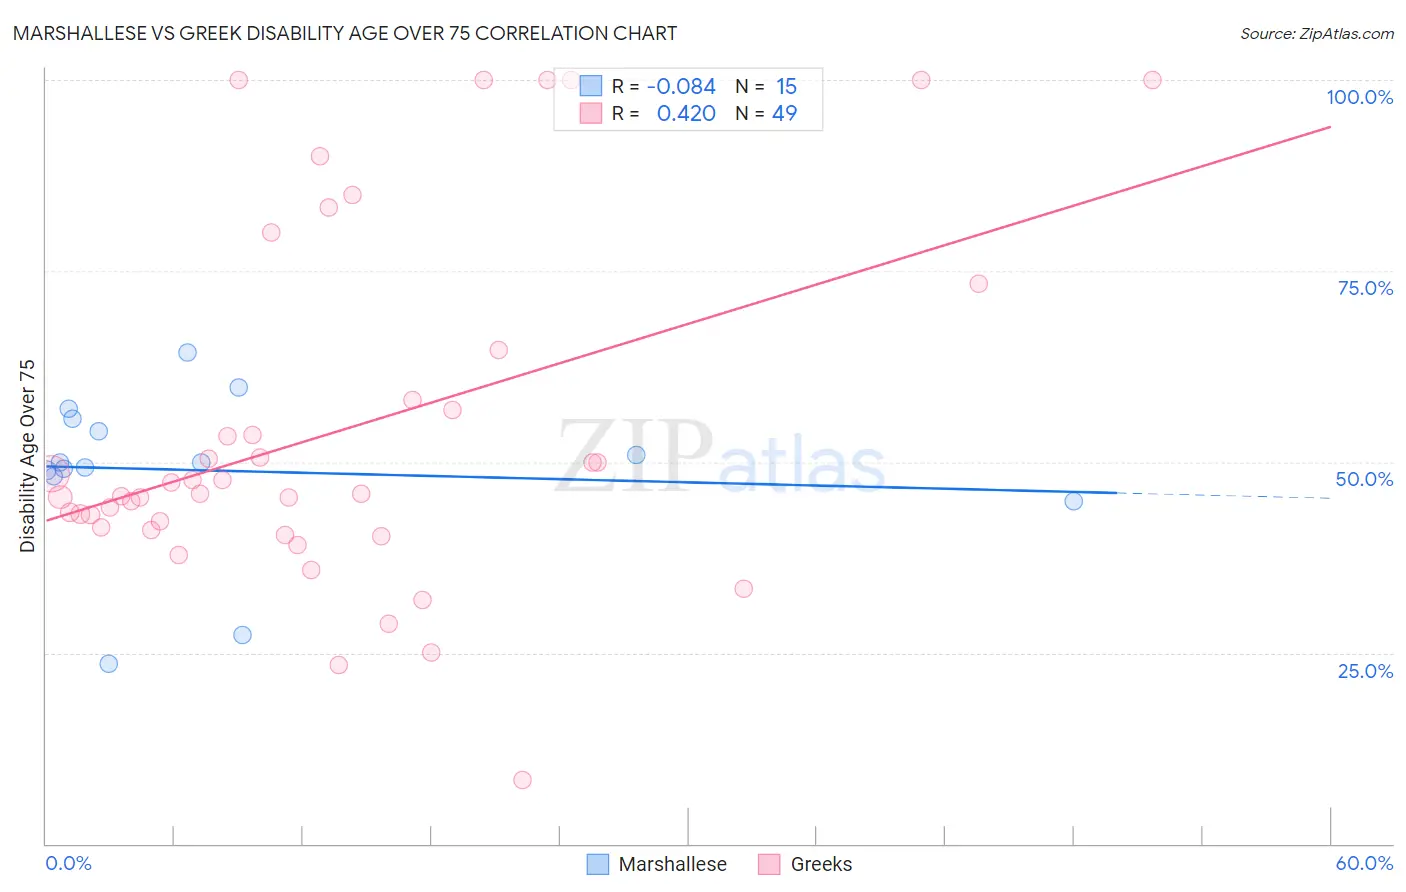
Marshallese vs Greek Disability Age Over 75 Correlation Chart
The statistical analysis conducted on geographies consisting of 14,759,035 people shows a slight negative correlation between the proportion of Marshallese and percentage of population with a disability over the age of 75 in the United States with a correlation coefficient (R) of -0.084 and weighted average of 50.1%. Similarly, the statistical analysis conducted on geographies consisting of 481,666,477 people shows a moderate positive correlation between the proportion of Greeks and percentage of population with a disability over the age of 75 in the United States with a correlation coefficient (R) of 0.420 and weighted average of 45.6%, a difference of 9.7%.
Disability Age Over 75 Correlation Summary
| Measurement | Marshallese | Greek |
| Minimum | 23.5% | 8.3% |
| Maximum | 64.3% | 100.0% |
| Range | 40.8% | 91.7% |
| Mean | 48.9% | 54.1% |
| Median | 49.9% | 45.8% |
| Interquartile 25% (IQ1) | 48.2% | 41.2% |
| Interquartile 75% (IQ3) | 55.7% | 61.4% |
| Interquartile Range (IQR) | 7.5% | 20.2% |
| Standard Deviation (Sample) | 10.8% | 22.9% |
| Standard Deviation (Population) | 10.4% | 22.7% |
Similar Demographics by Disability Age Over 75
Demographics Similar to Marshallese by Disability Age Over 75
In terms of disability age over 75, the demographic groups most similar to Marshallese are Armenian (50.0%, a difference of 0.050%), Immigrants from Micronesia (50.1%, a difference of 0.070%), Mexican American Indian (50.0%, a difference of 0.080%), Cape Verdean (50.1%, a difference of 0.10%), and Spanish American (50.0%, a difference of 0.12%).
| Demographics | Rating | Rank | Disability Age Over 75 |
| Arapaho | 0.0 /100 | #291 | Tragic 49.8% |
| Shoshone | 0.0 /100 | #292 | Tragic 49.9% |
| Spanish American Indians | 0.0 /100 | #293 | Tragic 49.9% |
| Immigrants | Cambodia | 0.0 /100 | #294 | Tragic 50.0% |
| Spanish Americans | 0.0 /100 | #295 | Tragic 50.0% |
| Mexican American Indians | 0.0 /100 | #296 | Tragic 50.0% |
| Armenians | 0.0 /100 | #297 | Tragic 50.0% |
| Marshallese | 0.0 /100 | #298 | Tragic 50.1% |
| Immigrants | Micronesia | 0.0 /100 | #299 | Tragic 50.1% |
| Cape Verdeans | 0.0 /100 | #300 | Tragic 50.1% |
| Dominicans | 0.0 /100 | #301 | Tragic 50.2% |
| Cherokee | 0.0 /100 | #302 | Tragic 50.2% |
| Japanese | 0.0 /100 | #303 | Tragic 50.2% |
| Immigrants | Dominican Republic | 0.0 /100 | #304 | Tragic 50.3% |
| Central American Indians | 0.0 /100 | #305 | Tragic 50.5% |
Demographics Similar to Greeks by Disability Age Over 75
In terms of disability age over 75, the demographic groups most similar to Greeks are Czech (45.7%, a difference of 0.0%), Immigrants from Singapore (45.6%, a difference of 0.040%), Australian (45.7%, a difference of 0.040%), Turkish (45.7%, a difference of 0.040%), and Swedish (45.7%, a difference of 0.070%).
| Demographics | Rating | Rank | Disability Age Over 75 |
| Norwegians | 99.9 /100 | #35 | Exceptional 45.5% |
| Immigrants | Taiwan | 99.9 /100 | #36 | Exceptional 45.5% |
| South Africans | 99.9 /100 | #37 | Exceptional 45.5% |
| Italians | 99.9 /100 | #38 | Exceptional 45.6% |
| Estonians | 99.9 /100 | #39 | Exceptional 45.6% |
| Slovenes | 99.9 /100 | #40 | Exceptional 45.6% |
| Immigrants | Singapore | 99.8 /100 | #41 | Exceptional 45.6% |
| Greeks | 99.8 /100 | #42 | Exceptional 45.6% |
| Czechs | 99.8 /100 | #43 | Exceptional 45.7% |
| Australians | 99.8 /100 | #44 | Exceptional 45.7% |
| Turks | 99.8 /100 | #45 | Exceptional 45.7% |
| Swedes | 99.8 /100 | #46 | Exceptional 45.7% |
| Immigrants | Canada | 99.8 /100 | #47 | Exceptional 45.7% |
| Croatians | 99.8 /100 | #48 | Exceptional 45.7% |
| Immigrants | North America | 99.8 /100 | #49 | Exceptional 45.7% |