Luxembourger vs Albanian Disability Age 65 to 74

COMPARE

Luxembourger
Race
Ancestry
AfghanAfricanAlaska NativeAlaskan AthabascanAleutAlsatianAmericanApacheArabArapahoArgentineanArmenianAssyrian/Chaldean/SyriacAustralianAustrianBahamianBangladeshiBarbadianBasqueBelgianBelizeanBermudanBhutaneseBlackfeetBolivianBrazilianBritishBritish West IndianBulgarianBurmeseCajunCambodianCanadianCape VerdeanCarpatho RusynCelticCentral AmericanCentral American IndianCherokeeCheyenneChickasawChileanChineseChippewaChoctawColombianColvilleComancheCosta RicanCreeCreekCroatianCrowCubanCypriotCzechCzechoslovakianDanishDelawareDominicanDutchDutch West IndianEastern EuropeanEcuadorianEgyptianEnglishEstonianEthiopianEuropeanFijianFilipinoFinnishFrenchFrench American IndianFrench CanadianGermanGerman RussianGhanaianGreekGuamanian/ChamorroGuatemalanGuyaneseHaitianHmongHonduranHopiHoumaHungarianIcelanderIndian (Asian)IndonesianInupiatIranianIraqiIrishIroquoisIsraeliItalianJamaicanJapaneseJordanianKenyanKiowaKoreanLaotianLatvianLebaneseLiberianLithuanianLumbeeLuxembourgerMacedonianMalaysianMalteseMarshalleseMenomineeMexicanMexican American IndianMongolianMoroccanNative HawaiianNavajoNepaleseNew ZealanderNicaraguanNigerianNorthern EuropeanNorwegianOkinawanOsageOttawaPaiutePakistaniPalestinianPanamanianParaguayanPennsylvania GermanPeruvianPimaPolishPortuguesePotawatomiPuebloPuerto RicanPuget Sound SalishRomanianRussianSalvadoranSamoanScandinavianScotch-IrishScottishSeminoleSenegaleseSerbianShoshoneSierra LeoneanSiouxSlavicSlovakSloveneSomaliSouth AfricanSouth AmericanSouth American IndianSoviet UnionSpaniardSpanishSpanish AmericanSpanish American IndianSri LankanSubsaharan AfricanSudaneseSwedishSwissSyrianTaiwaneseThaiTlingit-HaidaTohono O'OdhamTonganTrinidadian and TobagonianTsimshianTurkishU.S. Virgin IslanderUgandanUkrainianUruguayanUteVenezuelanVietnameseWelshWest IndianYakamaYaquiYugoslavianYumanYup'ikZimbabwean
Immigration
NonimmigrantsImmigrantsAfghanistanAfricaAlbaniaArgentinaArmeniaAsiaAustraliaAustriaBahamasBangladeshBarbadosBelarusBelgiumBelizeBoliviaBosnia and HerzegovinaBrazilBulgariaBurma/MyanmarCabo VerdeCambodiaCameroonCanadaCaribbeanCentral AmericaChileChinaColombiaCongoCosta RicaCroatiaCubaCzechoslovakiaDenmarkDominicaDominican RepublicEastern AfricaEastern AsiaEastern EuropeEcuadorEgyptEl SalvadorEnglandEritreaEthiopiaEuropeFijiFranceGermanyGhanaGreeceGrenadaGuatemalaGuyanaHaitiHondurasHong KongHungaryIndiaIndonesiaIranIraqIrelandIsraelItalyJamaicaJapanJordanKazakhstanKenyaKoreaKuwaitLaosLatin AmericaLatviaLebanonLiberiaLithuaniaMalaysiaMexicoMicronesiaMiddle AfricaMoldovaMoroccoNepalNetherlandsNicaraguaNigeriaNorth AmericaNorth MacedoniaNorthern AfricaNorthern EuropeNorwayOceaniaPakistanPanamaPeruPhilippinesPolandPortugalRomaniaRussiaSaudi ArabiaScotlandSenegalSerbiaSierra LeoneSingaporeSomaliaSouth AfricaSouth AmericaSouth Central AsiaSouth Eastern AsiaSouthern EuropeSpainSri LankaSt. Vincent and the GrenadinesSudanSwedenSwitzerlandSyriaTaiwanThailandTrinidad and TobagoTurkeyUgandaUkraineUruguayUzbekistanVenezuelaVietnamWest IndiesWestern AfricaWestern AsiaWestern EuropeYemenZaireZimbabweAzores
Albanian
Race
Ancestry
AfghanAfricanAlaska NativeAlaskan AthabascanAlbanianAleutAlsatianAmericanApacheArabArapahoArgentineanArmenianAssyrian/Chaldean/SyriacAustralianAustrianBahamianBangladeshiBarbadianBasqueBelgianBelizeanBermudanBhutaneseBlackfeetBolivianBrazilianBritishBritish West IndianBulgarianBurmeseCajunCambodianCanadianCape VerdeanCarpatho RusynCelticCentral AmericanCentral American IndianCherokeeCheyenneChickasawChileanChineseChippewaChoctawColombianColvilleComancheCosta RicanCreeCreekCroatianCrowCubanCypriotCzechCzechoslovakianDanishDelawareDominicanDutchDutch West IndianEastern EuropeanEcuadorianEgyptianEnglishEstonianEthiopianEuropeanFijianFilipinoFinnishFrenchFrench American IndianFrench CanadianGermanGerman RussianGhanaianGreekGuamanian/ChamorroGuatemalanGuyaneseHaitianHmongHonduranHopiHoumaHungarianIcelanderIndian (Asian)IndonesianInupiatIranianIraqiIrishIroquoisIsraeliItalianJamaicanJapaneseJordanianKenyanKiowaKoreanLaotianLatvianLebaneseLiberianLithuanianLumbeeMacedonianMalaysianMalteseMarshalleseMenomineeMexicanMexican American IndianMongolianMoroccanNative HawaiianNavajoNepaleseNew ZealanderNicaraguanNigerianNorthern EuropeanNorwegianOkinawanOsageOttawaPaiutePakistaniPalestinianPanamanianParaguayanPennsylvania GermanPeruvianPimaPolishPortuguesePotawatomiPuebloPuerto RicanPuget Sound SalishRomanianRussianSalvadoranSamoanScandinavianScotch-IrishScottishSeminoleSenegaleseSerbianShoshoneSierra LeoneanSiouxSlavicSlovakSloveneSomaliSouth AfricanSouth AmericanSouth American IndianSoviet UnionSpaniardSpanishSpanish AmericanSpanish American IndianSri LankanSubsaharan AfricanSudaneseSwedishSwissSyrianTaiwaneseThaiTlingit-HaidaTohono O'OdhamTonganTrinidadian and TobagonianTsimshianTurkishU.S. Virgin IslanderUgandanUkrainianUruguayanUteVenezuelanVietnameseWelshWest IndianYakamaYaquiYugoslavianYumanYup'ikZimbabwean
Immigration
NonimmigrantsImmigrantsAfghanistanAfricaAlbaniaArgentinaArmeniaAsiaAustraliaAustriaBahamasBangladeshBarbadosBelarusBelgiumBelizeBoliviaBosnia and HerzegovinaBrazilBulgariaBurma/MyanmarCabo VerdeCambodiaCameroonCanadaCaribbeanCentral AmericaChileChinaColombiaCongoCosta RicaCroatiaCubaCzechoslovakiaDenmarkDominicaDominican RepublicEastern AfricaEastern AsiaEastern EuropeEcuadorEgyptEl SalvadorEnglandEritreaEthiopiaEuropeFijiFranceGermanyGhanaGreeceGrenadaGuatemalaGuyanaHaitiHondurasHong KongHungaryIndiaIndonesiaIranIraqIrelandIsraelItalyJamaicaJapanJordanKazakhstanKenyaKoreaKuwaitLaosLatin AmericaLatviaLebanonLiberiaLithuaniaMalaysiaMexicoMicronesiaMiddle AfricaMoldovaMoroccoNepalNetherlandsNicaraguaNigeriaNorth AmericaNorth MacedoniaNorthern AfricaNorthern EuropeNorwayOceaniaPakistanPanamaPeruPhilippinesPolandPortugalRomaniaRussiaSaudi ArabiaScotlandSenegalSerbiaSierra LeoneSingaporeSomaliaSouth AfricaSouth AmericaSouth Central AsiaSouth Eastern AsiaSouthern EuropeSpainSri LankaSt. Vincent and the GrenadinesSudanSwedenSwitzerlandSyriaTaiwanThailandTrinidad and TobagoTurkeyUgandaUkraineUruguayUzbekistanVenezuelaVietnamWest IndiesWestern AfricaWestern AsiaWestern EuropeYemenZaireZimbabweAzores
Disability Age 65 to 74
Income
Poverty
Unemployment
Labor Participation
Family Structure
Vehicle Availability
Education Level
Disability

Disability Age 65 to 74 Comparison

Luxembourgers

Albanians

Exceptional
Exceptional
21.4%
DISABILITY AGE 65 TO 74
99.7/ 100
METRIC RATING
49th/ 347
METRIC RANK
22.3%
DISABILITY AGE 65 TO 74
95.8/ 100
METRIC RATING
109th/ 347
METRIC RANK

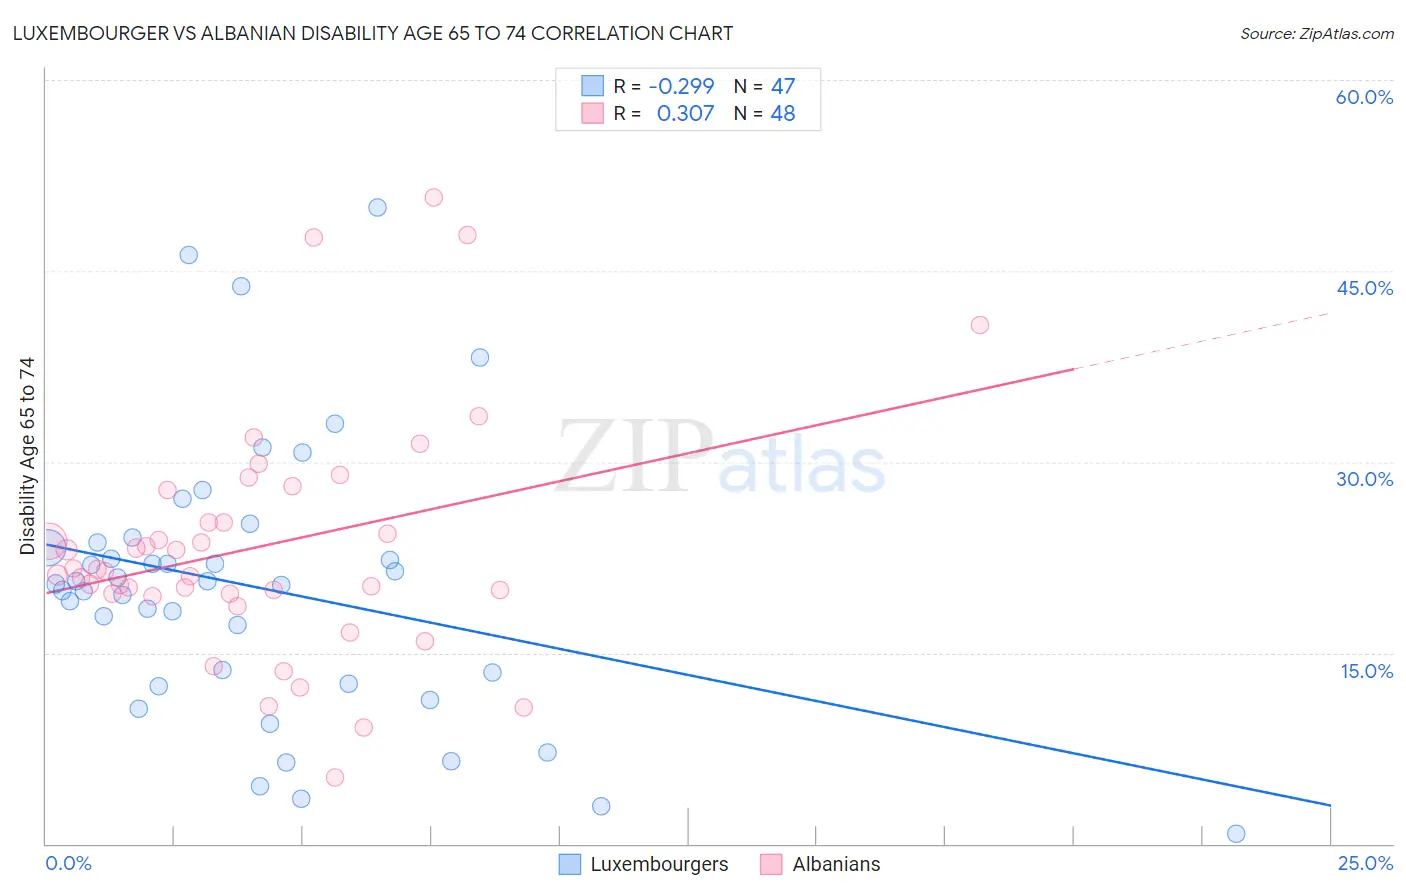
Luxembourger vs Albanian Disability Age 65 to 74 Correlation Chart

The statistical analysis conducted on geographies consisting of 144,546,595 people shows a weak negative correlation between the proportion of Luxembourgers and percentage of population with a disability between the ages 65 and 75 in the United States with a correlation coefficient (R) of -0.299 and weighted average of 21.4%. Similarly, the statistical analysis conducted on geographies consisting of 193,041,250 people shows a mild positive correlation between the proportion of Albanians and percentage of population with a disability between the ages 65 and 75 in the United States with a correlation coefficient (R) of 0.307 and weighted average of 22.3%, a difference of 4.1%.
Luxembourger vs Albanian Disability Age 65 to 74

Disability Age 65 to 74 Correlation Summary

MeasurementLuxembourgerAlbanian
Minimum0.83%5.2%
Maximum50.0%50.8%
Range49.2%45.6%
Mean20.1%23.3%
Median20.4%21.5%
Interquartile 25% (IQ1)12.6%19.6%
Interquartile 75% (IQ3)23.6%26.5%
Interquartile Range (IQR)11.1%6.9%
Standard Deviation (Sample)10.7%9.3%
Standard Deviation (Population)10.6%9.2%

Similar Demographics by Disability Age 65 to 74

Demographics Similar to Luxembourgers by Disability Age 65 to 74

In terms of disability age 65 to 74, the demographic groups most similar to Luxembourgers are Lithuanian (21.4%, a difference of 0.010%), Immigrants from Malaysia (21.4%, a difference of 0.030%), Immigrants from Turkey (21.4%, a difference of 0.050%), Immigrants from Bulgaria (21.4%, a difference of 0.050%), and Asian (21.4%, a difference of 0.080%).
DemographicsRating | RankDisability Age 65 to 74
Macedonians
99.7
/100
|
#42
Exceptional
21.3%
Immigrants | Croatia
99.7
/100
|
#43
Exceptional
21.3%
Estonians
99.7
/100
|
#44
Exceptional
21.4%
Asians
99.7
/100
|
#45
Exceptional
21.4%
Immigrants | Turkey
99.7
/100
|
#46
Exceptional
21.4%
Immigrants | Bulgaria
99.7
/100
|
#47
Exceptional
21.4%
Lithuanians
99.7
/100
|
#48
Exceptional
21.4%
Luxembourgers
99.7
/100
|
#49
Exceptional
21.4%
Immigrants | Malaysia
99.7
/100
|
#50
Exceptional
21.4%
Immigrants | Serbia
99.6
/100
|
#51
Exceptional
21.4%
Immigrants | France
99.6
/100
|
#52
Exceptional
21.5%
Bhutanese
99.6
/100
|
#53
Exceptional
21.5%
Immigrants | Italy
99.6
/100
|
#54
Exceptional
21.5%
Immigrants | Romania
99.5
/100
|
#55
Exceptional
21.5%
Immigrants | Denmark
99.5
/100
|
#56
Exceptional
21.5%

Demographics Similar to Albanians by Disability Age 65 to 74

In terms of disability age 65 to 74, the demographic groups most similar to Albanians are Immigrants from Peru (22.3%, a difference of 0.050%), Serbian (22.3%, a difference of 0.070%), Immigrants from Zimbabwe (22.3%, a difference of 0.090%), Slovene (22.2%, a difference of 0.10%), and Peruvian (22.2%, a difference of 0.11%).
DemographicsRating | RankDisability Age 65 to 74
Immigrants | Saudi Arabia
96.4
/100
|
#102
Exceptional
22.2%
South Americans
96.4
/100
|
#103
Exceptional
22.2%
Colombians
96.4
/100
|
#104
Exceptional
22.2%
Palestinians
96.3
/100
|
#105
Exceptional
22.2%
Peruvians
96.1
/100
|
#106
Exceptional
22.2%
Slovenes
96.1
/100
|
#107
Exceptional
22.2%
Immigrants | Zimbabwe
96.1
/100
|
#108
Exceptional
22.3%
Albanians
95.8
/100
|
#109
Exceptional
22.3%
Immigrants | Peru
95.7
/100
|
#110
Exceptional
22.3%
Serbians
95.7
/100
|
#111
Exceptional
22.3%
Immigrants | South America
95.5
/100
|
#112
Exceptional
22.3%
Syrians
95.3
/100
|
#113
Exceptional
22.3%
Ukrainians
95.1
/100
|
#114
Exceptional
22.3%
Laotians
94.9
/100
|
#115
Exceptional
22.3%
Brazilians
94.8
/100
|
#116
Exceptional
22.4%