Lithuanian vs Sri Lankan Disability Age 35 to 64
COMPARE
Lithuanian
Sri Lankan
Disability Age 35 to 64
Disability Age 35 to 64 Comparison
Lithuanians
Sri Lankans
10.8%
DISABILITY AGE 35 TO 64
88.7/ 100
METRIC RATING
144th/ 347
METRIC RANK
10.2%
DISABILITY AGE 35 TO 64
99.2/ 100
METRIC RATING
84th/ 347
METRIC RANK
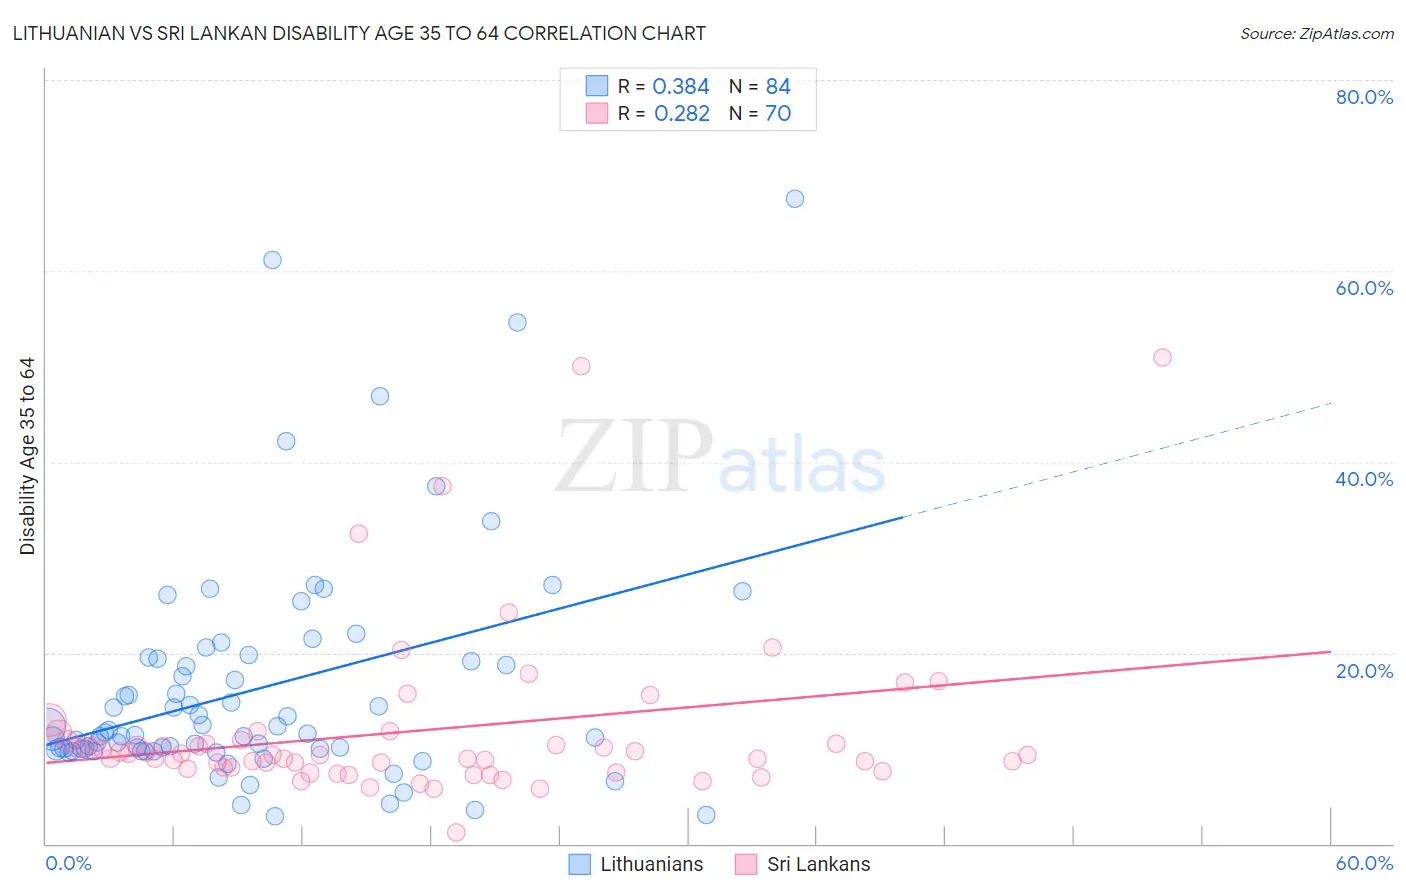
Lithuanian vs Sri Lankan Disability Age 35 to 64 Correlation Chart
The statistical analysis conducted on geographies consisting of 421,646,297 people shows a mild positive correlation between the proportion of Lithuanians and percentage of population with a disability between the ages 34 and 64 in the United States with a correlation coefficient (R) of 0.384 and weighted average of 10.8%. Similarly, the statistical analysis conducted on geographies consisting of 440,040,634 people shows a weak positive correlation between the proportion of Sri Lankans and percentage of population with a disability between the ages 34 and 64 in the United States with a correlation coefficient (R) of 0.282 and weighted average of 10.2%, a difference of 6.1%.
Disability Age 35 to 64 Correlation Summary
| Measurement | Lithuanian | Sri Lankan |
| Minimum | 2.9% | 1.2% |
| Maximum | 67.6% | 50.9% |
| Range | 64.7% | 49.7% |
| Mean | 16.1% | 11.8% |
| Median | 11.5% | 9.3% |
| Interquartile 25% (IQ1) | 9.9% | 8.0% |
| Interquartile 75% (IQ3) | 19.2% | 10.8% |
| Interquartile Range (IQR) | 9.3% | 2.7% |
| Standard Deviation (Sample) | 12.0% | 8.7% |
| Standard Deviation (Population) | 12.0% | 8.7% |
Similar Demographics by Disability Age 35 to 64
Demographics Similar to Lithuanians by Disability Age 35 to 64
In terms of disability age 35 to 64, the demographic groups most similar to Lithuanians are Sierra Leonean (10.8%, a difference of 0.21%), Immigrants from Saudi Arabia (10.8%, a difference of 0.43%), Australian (10.8%, a difference of 0.46%), Immigrants from Bangladesh (10.9%, a difference of 0.58%), and Immigrants from Scotland (10.7%, a difference of 0.59%).
| Demographics | Rating | Rank | Disability Age 35 to 64 |
| Immigrants | Costa Rica | 91.7 /100 | #137 | Exceptional 10.7% |
| Immigrants | Southern Europe | 91.5 /100 | #138 | Exceptional 10.7% |
| Costa Ricans | 91.4 /100 | #139 | Exceptional 10.7% |
| Immigrants | Scotland | 91.3 /100 | #140 | Exceptional 10.7% |
| Australians | 90.7 /100 | #141 | Exceptional 10.8% |
| Immigrants | Saudi Arabia | 90.6 /100 | #142 | Exceptional 10.8% |
| Sierra Leoneans | 89.7 /100 | #143 | Excellent 10.8% |
| Lithuanians | 88.7 /100 | #144 | Excellent 10.8% |
| Immigrants | Bangladesh | 85.6 /100 | #145 | Excellent 10.9% |
| South American Indians | 83.5 /100 | #146 | Excellent 10.9% |
| Immigrants | Eritrea | 83.4 /100 | #147 | Excellent 10.9% |
| Arabs | 82.7 /100 | #148 | Excellent 10.9% |
| Immigrants | Cameroon | 81.1 /100 | #149 | Excellent 10.9% |
| Syrians | 79.8 /100 | #150 | Good 11.0% |
| New Zealanders | 79.3 /100 | #151 | Good 11.0% |
Demographics Similar to Sri Lankans by Disability Age 35 to 64
In terms of disability age 35 to 64, the demographic groups most similar to Sri Lankans are Immigrants from Brazil (10.2%, a difference of 0.060%), Russian (10.2%, a difference of 0.080%), Latvian (10.2%, a difference of 0.13%), Immigrants from Kuwait (10.2%, a difference of 0.21%), and Immigrants from Croatia (10.2%, a difference of 0.23%).
| Demographics | Rating | Rank | Disability Age 35 to 64 |
| Mongolians | 99.4 /100 | #77 | Exceptional 10.1% |
| Jordanians | 99.3 /100 | #78 | Exceptional 10.1% |
| Immigrants | Vietnam | 99.3 /100 | #79 | Exceptional 10.1% |
| Immigrants | Croatia | 99.3 /100 | #80 | Exceptional 10.2% |
| Latvians | 99.2 /100 | #81 | Exceptional 10.2% |
| Russians | 99.2 /100 | #82 | Exceptional 10.2% |
| Immigrants | Brazil | 99.2 /100 | #83 | Exceptional 10.2% |
| Sri Lankans | 99.2 /100 | #84 | Exceptional 10.2% |
| Immigrants | Kuwait | 99.1 /100 | #85 | Exceptional 10.2% |
| Immigrants | Europe | 99.1 /100 | #86 | Exceptional 10.2% |
| Nicaraguans | 99.1 /100 | #87 | Exceptional 10.2% |
| Chileans | 99.0 /100 | #88 | Exceptional 10.2% |
| Uruguayans | 99.0 /100 | #89 | Exceptional 10.2% |
| Afghans | 98.9 /100 | #90 | Exceptional 10.3% |
| Immigrants | Lebanon | 98.9 /100 | #91 | Exceptional 10.3% |