Laotian vs Immigrants from Eastern Asia Disability Age 35 to 64
COMPARE
Laotian
Immigrants from Eastern Asia
Disability Age 35 to 64
Disability Age 35 to 64 Comparison
Laotians
Immigrants from Eastern Asia
10.1%
DISABILITY AGE 35 TO 64
99.4/ 100
METRIC RATING
74th/ 347
METRIC RANK
8.8%
DISABILITY AGE 35 TO 64
100.0/ 100
METRIC RATING
11th/ 347
METRIC RANK
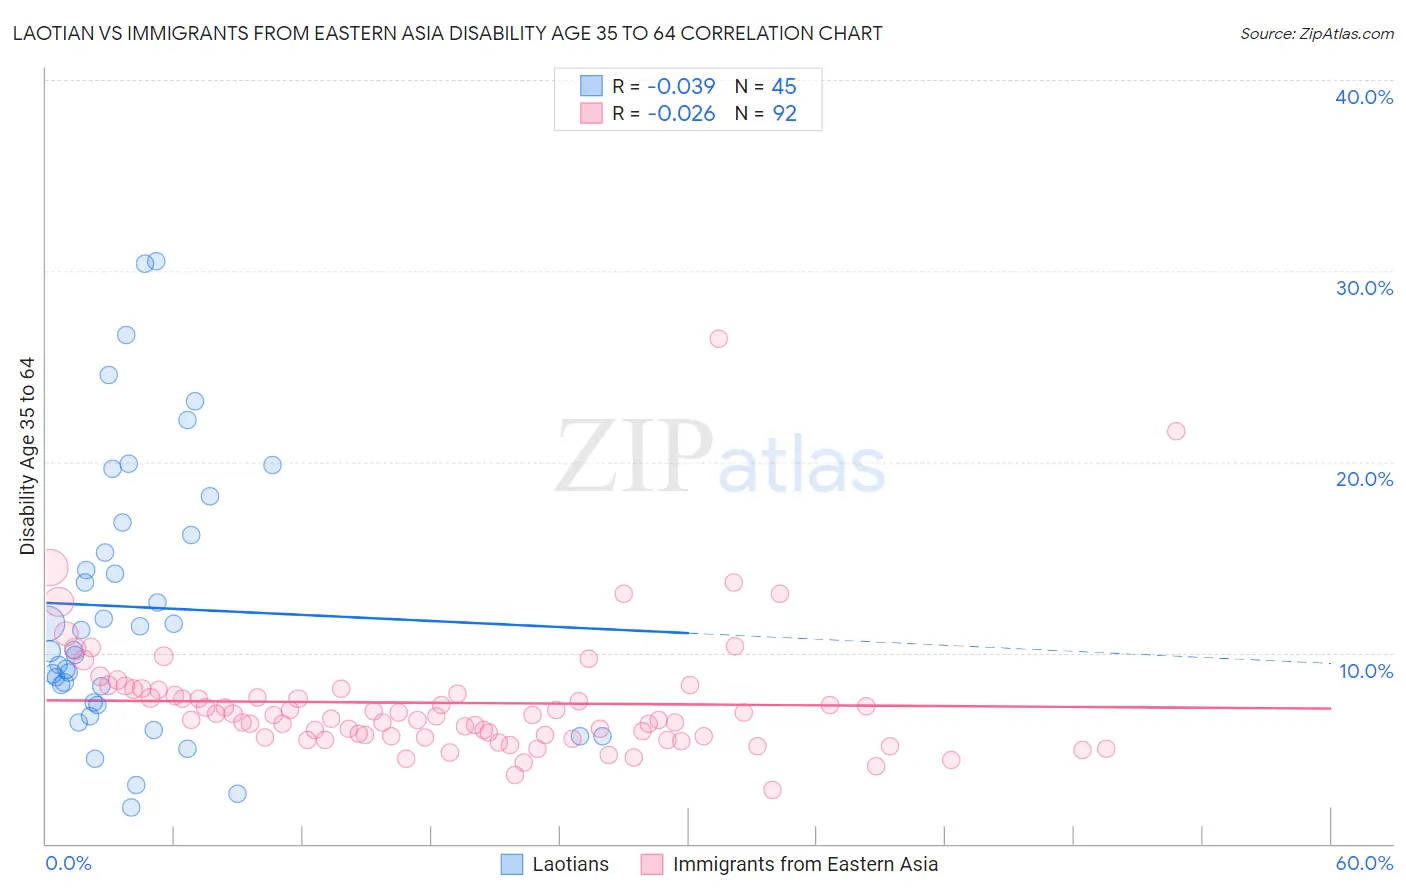
Laotian vs Immigrants from Eastern Asia Disability Age 35 to 64 Correlation Chart
The statistical analysis conducted on geographies consisting of 224,740,086 people shows no correlation between the proportion of Laotians and percentage of population with a disability between the ages 34 and 64 in the United States with a correlation coefficient (R) of -0.039 and weighted average of 10.1%. Similarly, the statistical analysis conducted on geographies consisting of 499,262,444 people shows no correlation between the proportion of Immigrants from Eastern Asia and percentage of population with a disability between the ages 34 and 64 in the United States with a correlation coefficient (R) of -0.026 and weighted average of 8.8%, a difference of 15.1%.
Disability Age 35 to 64 Correlation Summary
| Measurement | Laotian | Immigrants from Eastern Asia |
| Minimum | 1.9% | 2.8% |
| Maximum | 30.5% | 26.5% |
| Range | 28.6% | 23.7% |
| Mean | 12.4% | 7.4% |
| Median | 10.2% | 6.6% |
| Interquartile 25% (IQ1) | 7.3% | 5.6% |
| Interquartile 75% (IQ3) | 16.5% | 8.0% |
| Interquartile Range (IQR) | 9.1% | 2.4% |
| Standard Deviation (Sample) | 7.2% | 3.3% |
| Standard Deviation (Population) | 7.1% | 3.3% |
Similar Demographics by Disability Age 35 to 64
Demographics Similar to Laotians by Disability Age 35 to 64
In terms of disability age 35 to 64, the demographic groups most similar to Laotians are Immigrants from Latvia (10.1%, a difference of 0.090%), Immigrants from Chile (10.1%, a difference of 0.10%), Mongolian (10.1%, a difference of 0.14%), Immigrants from France (10.1%, a difference of 0.18%), and Immigrants from Northern Europe (10.1%, a difference of 0.19%).
| Demographics | Rating | Rank | Disability Age 35 to 64 |
| Immigrants | Uzbekistan | 99.5 /100 | #67 | Exceptional 10.1% |
| Immigrants | Switzerland | 99.5 /100 | #68 | Exceptional 10.1% |
| Immigrants | Eastern Europe | 99.5 /100 | #69 | Exceptional 10.1% |
| Immigrants | Nicaragua | 99.5 /100 | #70 | Exceptional 10.1% |
| Immigrants | Kazakhstan | 99.5 /100 | #71 | Exceptional 10.1% |
| Immigrants | Northern Europe | 99.5 /100 | #72 | Exceptional 10.1% |
| Immigrants | France | 99.5 /100 | #73 | Exceptional 10.1% |
| Laotians | 99.4 /100 | #74 | Exceptional 10.1% |
| Immigrants | Latvia | 99.4 /100 | #75 | Exceptional 10.1% |
| Immigrants | Chile | 99.4 /100 | #76 | Exceptional 10.1% |
| Mongolians | 99.4 /100 | #77 | Exceptional 10.1% |
| Jordanians | 99.3 /100 | #78 | Exceptional 10.1% |
| Immigrants | Vietnam | 99.3 /100 | #79 | Exceptional 10.1% |
| Immigrants | Croatia | 99.3 /100 | #80 | Exceptional 10.2% |
| Latvians | 99.2 /100 | #81 | Exceptional 10.2% |
Demographics Similar to Immigrants from Eastern Asia by Disability Age 35 to 64
In terms of disability age 35 to 64, the demographic groups most similar to Immigrants from Eastern Asia are Immigrants from Bolivia (8.7%, a difference of 0.70%), Indian (Asian) (8.9%, a difference of 0.78%), Immigrants from South Central Asia (8.9%, a difference of 0.88%), Immigrants from China (8.7%, a difference of 0.97%), and Iranian (8.7%, a difference of 1.4%).
| Demographics | Rating | Rank | Disability Age 35 to 64 |
| Immigrants | India | 100.0 /100 | #4 | Exceptional 8.3% |
| Immigrants | Iran | 100.0 /100 | #5 | Exceptional 8.5% |
| Thais | 100.0 /100 | #6 | Exceptional 8.6% |
| Immigrants | Israel | 100.0 /100 | #7 | Exceptional 8.6% |
| Iranians | 100.0 /100 | #8 | Exceptional 8.7% |
| Immigrants | China | 100.0 /100 | #9 | Exceptional 8.7% |
| Immigrants | Bolivia | 100.0 /100 | #10 | Exceptional 8.7% |
| Immigrants | Eastern Asia | 100.0 /100 | #11 | Exceptional 8.8% |
| Indians (Asian) | 100.0 /100 | #12 | Exceptional 8.9% |
| Immigrants | South Central Asia | 100.0 /100 | #13 | Exceptional 8.9% |
| Immigrants | Singapore | 100.0 /100 | #14 | Exceptional 8.9% |
| Bolivians | 100.0 /100 | #15 | Exceptional 8.9% |
| Immigrants | Korea | 100.0 /100 | #16 | Exceptional 9.0% |
| Burmese | 100.0 /100 | #17 | Exceptional 9.2% |
| Soviet Union | 100.0 /100 | #18 | Exceptional 9.2% |