Inupiat vs Immigrants from Egypt Disability Age 35 to 64
COMPARE
Inupiat
Immigrants from Egypt
Disability Age 35 to 64
Disability Age 35 to 64 Comparison
Inupiat
Immigrants from Egypt
14.1%
DISABILITY AGE 35 TO 64
0.0/ 100
METRIC RATING
308th/ 347
METRIC RANK
9.8%
DISABILITY AGE 35 TO 64
99.9/ 100
METRIC RATING
44th/ 347
METRIC RANK
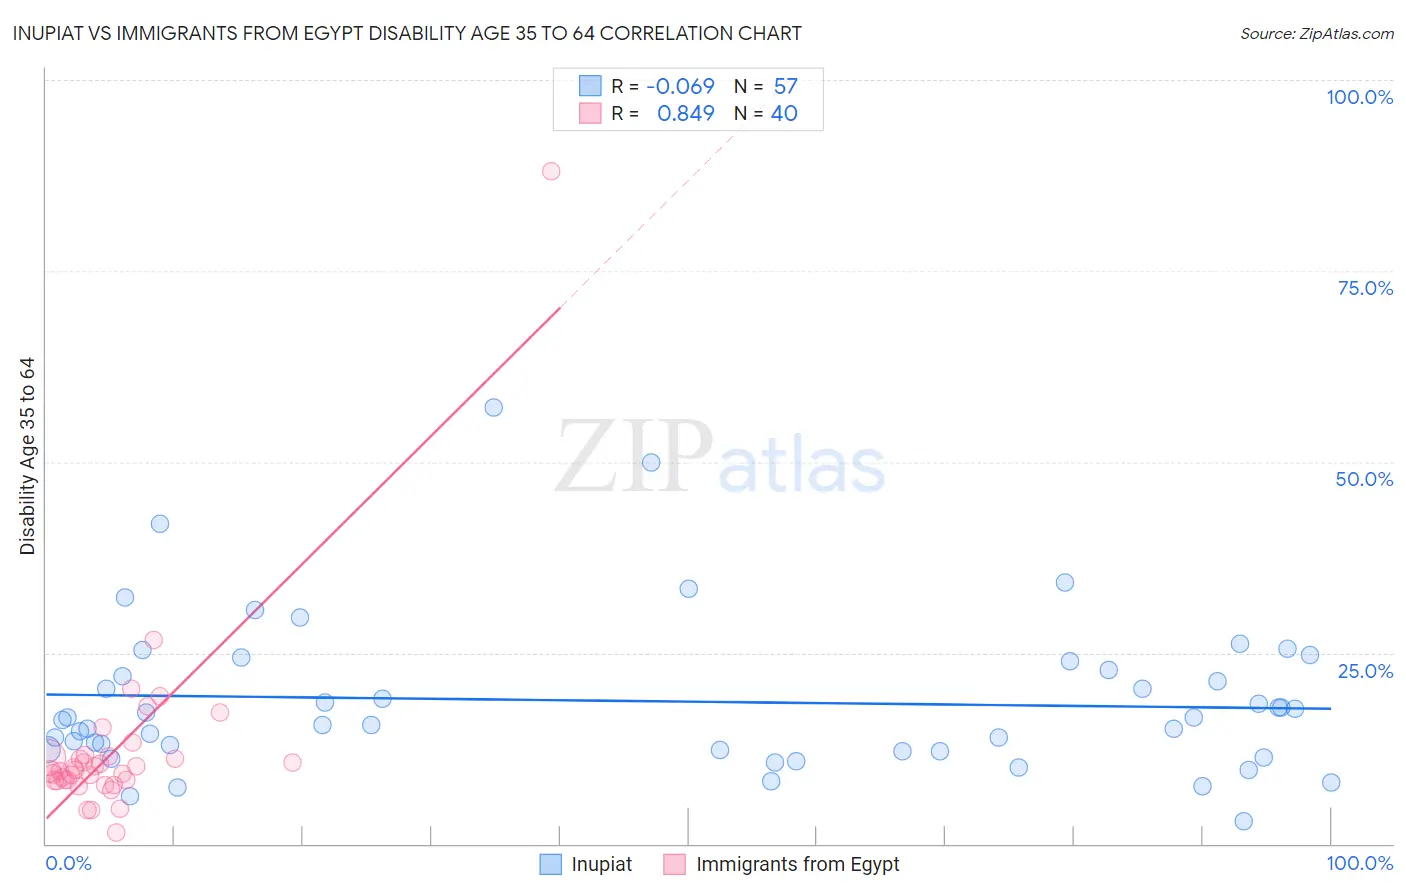
Inupiat vs Immigrants from Egypt Disability Age 35 to 64 Correlation Chart
The statistical analysis conducted on geographies consisting of 96,326,282 people shows a slight negative correlation between the proportion of Inupiat and percentage of population with a disability between the ages 34 and 64 in the United States with a correlation coefficient (R) of -0.069 and weighted average of 14.1%. Similarly, the statistical analysis conducted on geographies consisting of 245,410,739 people shows a very strong positive correlation between the proportion of Immigrants from Egypt and percentage of population with a disability between the ages 34 and 64 in the United States with a correlation coefficient (R) of 0.849 and weighted average of 9.8%, a difference of 43.7%.
Disability Age 35 to 64 Correlation Summary
| Measurement | Inupiat | Immigrants from Egypt |
| Minimum | 2.9% | 1.5% |
| Maximum | 57.1% | 88.0% |
| Range | 54.2% | 86.5% |
| Mean | 18.7% | 12.4% |
| Median | 16.2% | 9.6% |
| Interquartile 25% (IQ1) | 12.2% | 8.3% |
| Interquartile 75% (IQ3) | 23.3% | 11.4% |
| Interquartile Range (IQR) | 11.1% | 3.0% |
| Standard Deviation (Sample) | 10.3% | 13.1% |
| Standard Deviation (Population) | 10.2% | 12.9% |
Similar Demographics by Disability Age 35 to 64
Demographics Similar to Inupiat by Disability Age 35 to 64
In terms of disability age 35 to 64, the demographic groups most similar to Inupiat are Blackfeet (14.1%, a difference of 0.030%), Cree (14.1%, a difference of 0.070%), Immigrants from Yemen (14.0%, a difference of 0.19%), Cape Verdean (14.1%, a difference of 0.54%), and American (13.9%, a difference of 1.1%).
| Demographics | Rating | Rank | Disability Age 35 to 64 |
| French American Indians | 0.0 /100 | #301 | Tragic 13.7% |
| Aleuts | 0.0 /100 | #302 | Tragic 13.8% |
| Sioux | 0.0 /100 | #303 | Tragic 13.9% |
| Hopi | 0.0 /100 | #304 | Tragic 13.9% |
| Americans | 0.0 /100 | #305 | Tragic 13.9% |
| Immigrants | Yemen | 0.0 /100 | #306 | Tragic 14.0% |
| Blackfeet | 0.0 /100 | #307 | Tragic 14.1% |
| Inupiat | 0.0 /100 | #308 | Tragic 14.1% |
| Cree | 0.0 /100 | #309 | Tragic 14.1% |
| Cape Verdeans | 0.0 /100 | #310 | Tragic 14.1% |
| Immigrants | Azores | 0.0 /100 | #311 | Tragic 14.3% |
| Paiute | 0.0 /100 | #312 | Tragic 14.3% |
| Iroquois | 0.0 /100 | #313 | Tragic 14.4% |
| Shoshone | 0.0 /100 | #314 | Tragic 14.5% |
| Alaska Natives | 0.0 /100 | #315 | Tragic 14.5% |
Demographics Similar to Immigrants from Egypt by Disability Age 35 to 64
In terms of disability age 35 to 64, the demographic groups most similar to Immigrants from Egypt are Immigrants from Peru (9.8%, a difference of 0.060%), Cambodian (9.8%, a difference of 0.25%), Immigrants from Colombia (9.8%, a difference of 0.29%), Immigrants from Belgium (9.8%, a difference of 0.30%), and Immigrants from Serbia (9.8%, a difference of 0.31%).
| Demographics | Rating | Rank | Disability Age 35 to 64 |
| Immigrants | Turkey | 99.9 /100 | #37 | Exceptional 9.7% |
| Egyptians | 99.9 /100 | #38 | Exceptional 9.7% |
| Immigrants | Belarus | 99.9 /100 | #39 | Exceptional 9.7% |
| Immigrants | Armenia | 99.9 /100 | #40 | Exceptional 9.7% |
| Israelis | 99.9 /100 | #41 | Exceptional 9.7% |
| Immigrants | Malaysia | 99.9 /100 | #42 | Exceptional 9.7% |
| Immigrants | Colombia | 99.9 /100 | #43 | Exceptional 9.8% |
| Immigrants | Egypt | 99.9 /100 | #44 | Exceptional 9.8% |
| Immigrants | Peru | 99.9 /100 | #45 | Exceptional 9.8% |
| Cambodians | 99.8 /100 | #46 | Exceptional 9.8% |
| Immigrants | Belgium | 99.8 /100 | #47 | Exceptional 9.8% |
| Immigrants | Serbia | 99.8 /100 | #48 | Exceptional 9.8% |
| Immigrants | Greece | 99.8 /100 | #49 | Exceptional 9.8% |
| Paraguayans | 99.8 /100 | #50 | Exceptional 9.8% |
| Bhutanese | 99.8 /100 | #51 | Exceptional 9.8% |