Immigrants from Zimbabwe vs Immigrants from Western Europe Disability Age 65 to 74
COMPARE
Immigrants from Zimbabwe
Immigrants from Western Europe
Disability Age 65 to 74
Disability Age 65 to 74 Comparison
Immigrants from Zimbabwe
Immigrants from Western Europe
22.3%
DISABILITY AGE 65 TO 74
96.1/ 100
METRIC RATING
108th/ 347
METRIC RANK
22.5%
DISABILITY AGE 65 TO 74
92.3/ 100
METRIC RATING
125th/ 347
METRIC RANK
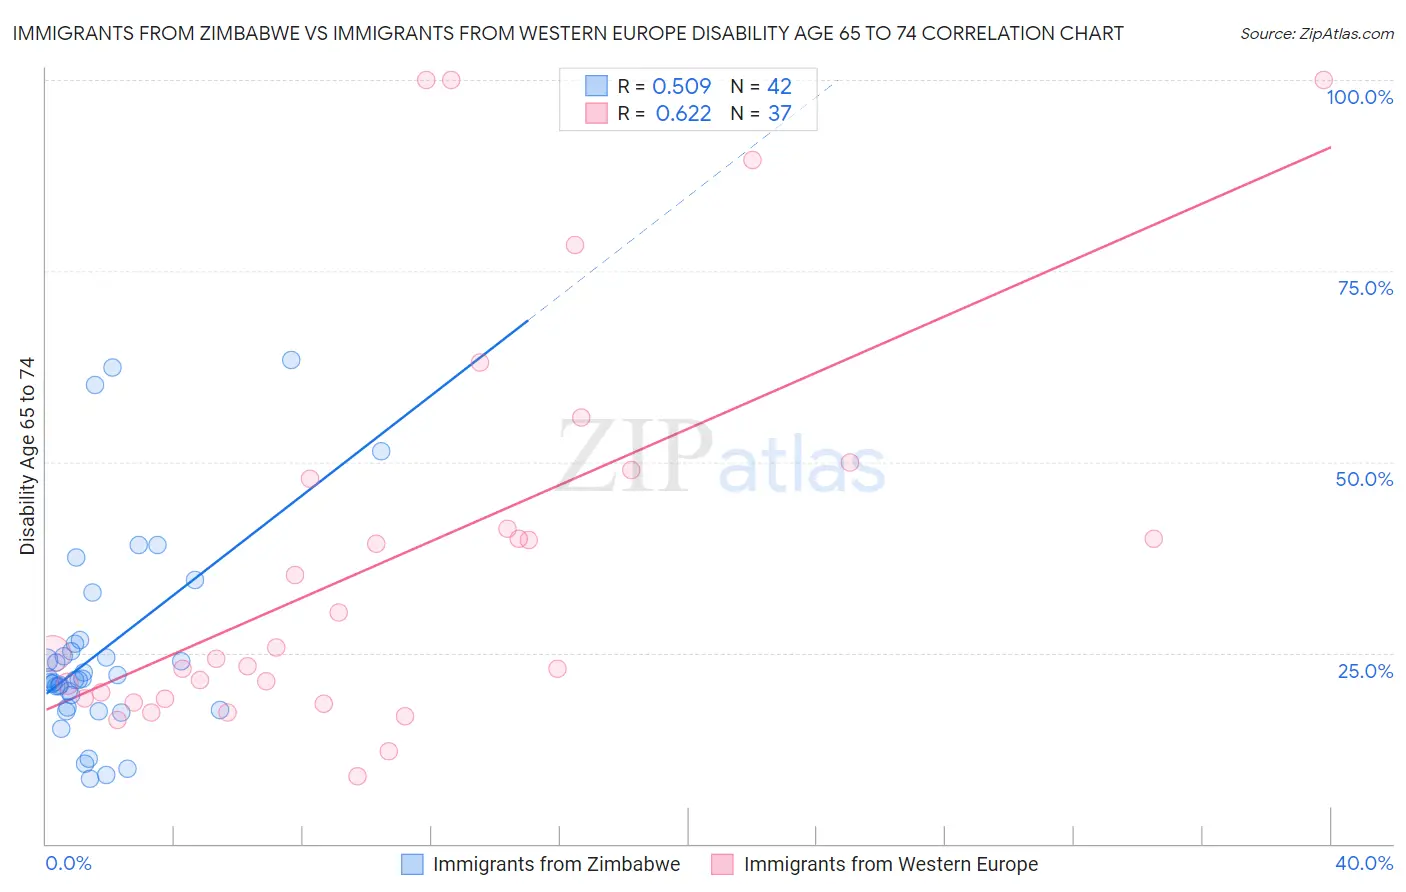
Immigrants from Zimbabwe vs Immigrants from Western Europe Disability Age 65 to 74 Correlation Chart
The statistical analysis conducted on geographies consisting of 117,717,454 people shows a substantial positive correlation between the proportion of Immigrants from Zimbabwe and percentage of population with a disability between the ages 65 and 75 in the United States with a correlation coefficient (R) of 0.509 and weighted average of 22.3%. Similarly, the statistical analysis conducted on geographies consisting of 492,995,439 people shows a significant positive correlation between the proportion of Immigrants from Western Europe and percentage of population with a disability between the ages 65 and 75 in the United States with a correlation coefficient (R) of 0.622 and weighted average of 22.5%, a difference of 1.1%.
Disability Age 65 to 74 Correlation Summary
| Measurement | Immigrants from Zimbabwe | Immigrants from Western Europe |
| Minimum | 8.6% | 8.8% |
| Maximum | 63.3% | 100.0% |
| Range | 54.7% | 91.2% |
| Mean | 25.4% | 37.5% |
| Median | 21.6% | 24.8% |
| Interquartile 25% (IQ1) | 17.8% | 19.0% |
| Interquartile 75% (IQ3) | 26.2% | 48.3% |
| Interquartile Range (IQR) | 8.4% | 29.3% |
| Standard Deviation (Sample) | 13.3% | 26.0% |
| Standard Deviation (Population) | 13.2% | 25.7% |
Demographics Similar to Immigrants from Zimbabwe and Immigrants from Western Europe by Disability Age 65 to 74
In terms of disability age 65 to 74, the demographic groups most similar to Immigrants from Zimbabwe are Slovene (22.2%, a difference of 0.010%), Peruvian (22.2%, a difference of 0.020%), Albanian (22.3%, a difference of 0.090%), Immigrants from Peru (22.3%, a difference of 0.14%), and Serbian (22.3%, a difference of 0.16%). Similarly, the demographic groups most similar to Immigrants from Western Europe are Lebanese (22.5%, a difference of 0.020%), Norwegian (22.5%, a difference of 0.040%), Hungarian (22.4%, a difference of 0.23%), Czech (22.4%, a difference of 0.28%), and Immigrants from Jordan (22.4%, a difference of 0.28%).
| Demographics | Rating | Rank | Disability Age 65 to 74 |
| Peruvians | 96.1 /100 | #106 | Exceptional 22.2% |
| Slovenes | 96.1 /100 | #107 | Exceptional 22.2% |
| Immigrants | Zimbabwe | 96.1 /100 | #108 | Exceptional 22.3% |
| Albanians | 95.8 /100 | #109 | Exceptional 22.3% |
| Immigrants | Peru | 95.7 /100 | #110 | Exceptional 22.3% |
| Serbians | 95.7 /100 | #111 | Exceptional 22.3% |
| Immigrants | South America | 95.5 /100 | #112 | Exceptional 22.3% |
| Syrians | 95.3 /100 | #113 | Exceptional 22.3% |
| Ukrainians | 95.1 /100 | #114 | Exceptional 22.3% |
| Laotians | 94.9 /100 | #115 | Exceptional 22.3% |
| Brazilians | 94.8 /100 | #116 | Exceptional 22.4% |
| Swedes | 94.7 /100 | #117 | Exceptional 22.4% |
| Austrians | 94.7 /100 | #118 | Exceptional 22.4% |
| Immigrants | Northern Africa | 94.7 /100 | #119 | Exceptional 22.4% |
| Immigrants | Kazakhstan | 93.9 /100 | #120 | Exceptional 22.4% |
| Czechs | 93.5 /100 | #121 | Exceptional 22.4% |
| Immigrants | Jordan | 93.5 /100 | #122 | Exceptional 22.4% |
| Hungarians | 93.3 /100 | #123 | Exceptional 22.4% |
| Norwegians | 92.5 /100 | #124 | Exceptional 22.5% |
| Immigrants | Western Europe | 92.3 /100 | #125 | Exceptional 22.5% |
| Lebanese | 92.2 /100 | #126 | Exceptional 22.5% |