Immigrants from Western Europe vs European Hearing Disability
COMPARE
Immigrants from Western Europe
European
Hearing Disability
Hearing Disability Comparison
Immigrants from Western Europe
Europeans
3.3%
HEARING DISABILITY
1.0/ 100
METRIC RATING
243rd/ 347
METRIC RANK
3.5%
HEARING DISABILITY
0.1/ 100
METRIC RATING
270th/ 347
METRIC RANK
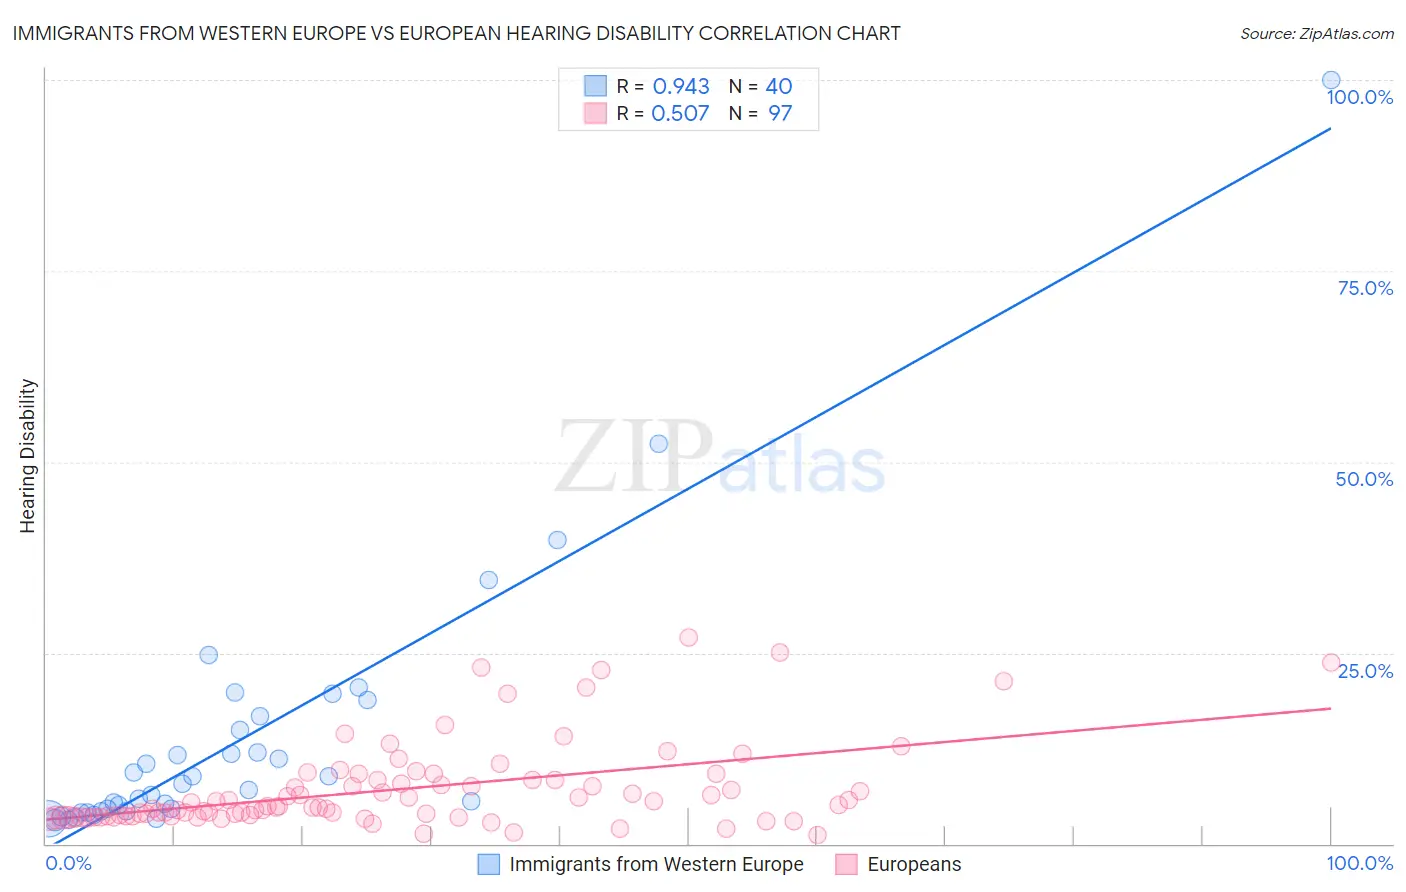
Immigrants from Western Europe vs European Hearing Disability Correlation Chart
The statistical analysis conducted on geographies consisting of 493,839,784 people shows a near-perfect positive correlation between the proportion of Immigrants from Western Europe and percentage of population with hearing disability in the United States with a correlation coefficient (R) of 0.943 and weighted average of 3.3%. Similarly, the statistical analysis conducted on geographies consisting of 561,261,732 people shows a substantial positive correlation between the proportion of Europeans and percentage of population with hearing disability in the United States with a correlation coefficient (R) of 0.507 and weighted average of 3.5%, a difference of 5.7%.
Hearing Disability Correlation Summary
| Measurement | Immigrants from Western Europe | European |
| Minimum | 3.1% | 1.1% |
| Maximum | 100.0% | 27.1% |
| Range | 96.9% | 26.0% |
| Mean | 13.6% | 7.2% |
| Median | 7.5% | 4.8% |
| Interquartile 25% (IQ1) | 4.3% | 3.6% |
| Interquartile 75% (IQ3) | 15.8% | 8.3% |
| Interquartile Range (IQR) | 11.5% | 4.8% |
| Standard Deviation (Sample) | 17.7% | 5.6% |
| Standard Deviation (Population) | 17.4% | 5.6% |
Similar Demographics by Hearing Disability
Demographics Similar to Immigrants from Western Europe by Hearing Disability
In terms of hearing disability, the demographic groups most similar to Immigrants from Western Europe are Assyrian/Chaldean/Syriac (3.3%, a difference of 0.070%), Yugoslavian (3.3%, a difference of 0.17%), Samoan (3.3%, a difference of 0.28%), Immigrants from Netherlands (3.3%, a difference of 0.35%), and Immigrants from Scotland (3.3%, a difference of 0.41%).
| Demographics | Rating | Rank | Hearing Disability |
| Serbians | 2.2 /100 | #236 | Tragic 3.3% |
| Immigrants | Austria | 1.8 /100 | #237 | Tragic 3.3% |
| German Russians | 1.8 /100 | #238 | Tragic 3.3% |
| Nepalese | 1.2 /100 | #239 | Tragic 3.3% |
| Immigrants | Netherlands | 1.1 /100 | #240 | Tragic 3.3% |
| Samoans | 1.1 /100 | #241 | Tragic 3.3% |
| Yugoslavians | 1.0 /100 | #242 | Tragic 3.3% |
| Immigrants | Western Europe | 1.0 /100 | #243 | Tragic 3.3% |
| Assyrians/Chaldeans/Syriacs | 0.9 /100 | #244 | Tragic 3.3% |
| Immigrants | Scotland | 0.8 /100 | #245 | Tragic 3.3% |
| Immigrants | England | 0.7 /100 | #246 | Tragic 3.3% |
| Lithuanians | 0.6 /100 | #247 | Tragic 3.4% |
| Austrians | 0.6 /100 | #248 | Tragic 3.4% |
| Italians | 0.4 /100 | #249 | Tragic 3.4% |
| Yuman | 0.4 /100 | #250 | Tragic 3.4% |
Demographics Similar to Europeans by Hearing Disability
In terms of hearing disability, the demographic groups most similar to Europeans are Czech (3.5%, a difference of 0.26%), Ute (3.5%, a difference of 0.35%), Fijian (3.5%, a difference of 0.52%), Puerto Rican (3.5%, a difference of 0.59%), and Spaniard (3.5%, a difference of 0.65%).
| Demographics | Rating | Rank | Hearing Disability |
| Immigrants | Canada | 0.1 /100 | #263 | Tragic 3.5% |
| Immigrants | Germany | 0.1 /100 | #264 | Tragic 3.5% |
| British | 0.1 /100 | #265 | Tragic 3.5% |
| Belgians | 0.1 /100 | #266 | Tragic 3.5% |
| Canadians | 0.1 /100 | #267 | Tragic 3.5% |
| Spaniards | 0.1 /100 | #268 | Tragic 3.5% |
| Ute | 0.1 /100 | #269 | Tragic 3.5% |
| Europeans | 0.1 /100 | #270 | Tragic 3.5% |
| Czechs | 0.1 /100 | #271 | Tragic 3.5% |
| Fijians | 0.0 /100 | #272 | Tragic 3.5% |
| Puerto Ricans | 0.0 /100 | #273 | Tragic 3.5% |
| Swiss | 0.0 /100 | #274 | Tragic 3.5% |
| Czechoslovakians | 0.0 /100 | #275 | Tragic 3.6% |
| Danes | 0.0 /100 | #276 | Tragic 3.6% |
| Immigrants | Nonimmigrants | 0.0 /100 | #277 | Tragic 3.6% |