Immigrants from West Indies vs French Ambulatory Disability
COMPARE
Immigrants from West Indies
French
Ambulatory Disability
Ambulatory Disability Comparison
Immigrants from West Indies
French
6.7%
AMBULATORY DISABILITY
0.1/ 100
METRIC RATING
278th/ 347
METRIC RANK
6.6%
AMBULATORY DISABILITY
0.1/ 100
METRIC RATING
269th/ 347
METRIC RANK
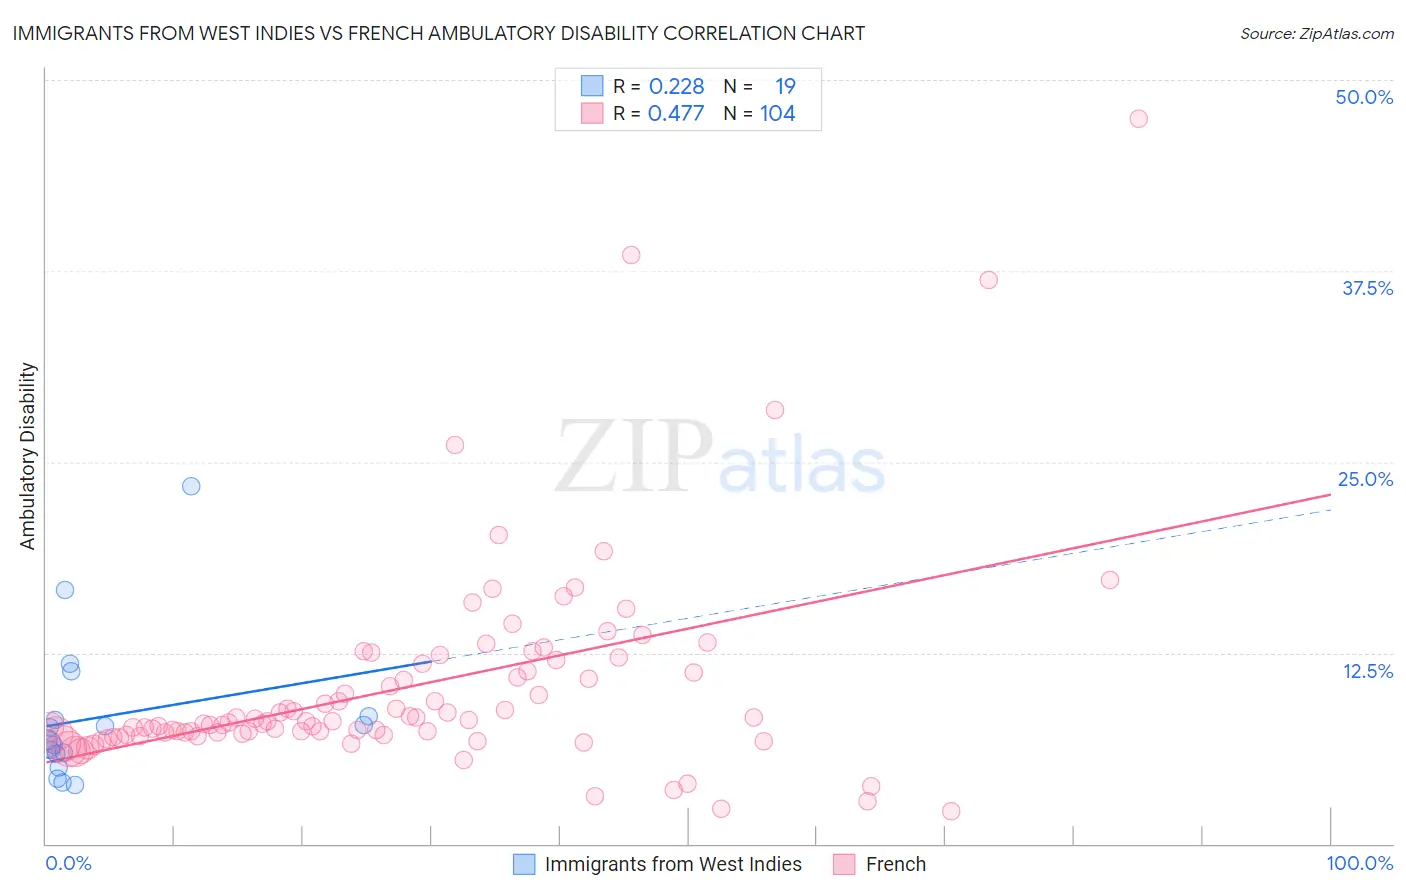
Immigrants from West Indies vs French Ambulatory Disability Correlation Chart
The statistical analysis conducted on geographies consisting of 72,456,461 people shows a weak positive correlation between the proportion of Immigrants from West Indies and percentage of population with ambulatory disability in the United States with a correlation coefficient (R) of 0.228 and weighted average of 6.7%. Similarly, the statistical analysis conducted on geographies consisting of 571,874,701 people shows a moderate positive correlation between the proportion of French and percentage of population with ambulatory disability in the United States with a correlation coefficient (R) of 0.477 and weighted average of 6.6%, a difference of 1.1%.
Ambulatory Disability Correlation Summary
| Measurement | Immigrants from West Indies | French |
| Minimum | 3.8% | 2.1% |
| Maximum | 23.4% | 47.5% |
| Range | 19.6% | 45.4% |
| Mean | 8.3% | 10.2% |
| Median | 6.8% | 8.0% |
| Interquartile 25% (IQ1) | 5.9% | 7.2% |
| Interquartile 75% (IQ3) | 8.3% | 11.6% |
| Interquartile Range (IQR) | 2.4% | 4.4% |
| Standard Deviation (Sample) | 4.8% | 6.9% |
| Standard Deviation (Population) | 4.7% | 6.8% |
Demographics Similar to Immigrants from West Indies and French by Ambulatory Disability
In terms of ambulatory disability, the demographic groups most similar to Immigrants from West Indies are Jamaican (6.7%, a difference of 0.080%), Celtic (6.7%, a difference of 0.15%), Immigrants from Guyana (6.7%, a difference of 0.18%), Sioux (6.7%, a difference of 0.25%), and Immigrants from Caribbean (6.7%, a difference of 0.31%). Similarly, the demographic groups most similar to French are Slovak (6.7%, a difference of 0.16%), Immigrants from Trinidad and Tobago (6.7%, a difference of 0.26%), Spanish (6.6%, a difference of 0.31%), Trinidadian and Tobagonian (6.6%, a difference of 0.32%), and Guyanese (6.6%, a difference of 0.45%).
| Demographics | Rating | Rank | Ambulatory Disability |
| Hmong | 0.3 /100 | #263 | Tragic 6.6% |
| Nepalese | 0.2 /100 | #264 | Tragic 6.6% |
| Bahamians | 0.2 /100 | #265 | Tragic 6.6% |
| Guyanese | 0.2 /100 | #266 | Tragic 6.6% |
| Trinidadians and Tobagonians | 0.2 /100 | #267 | Tragic 6.6% |
| Spanish | 0.2 /100 | #268 | Tragic 6.6% |
| French | 0.1 /100 | #269 | Tragic 6.6% |
| Slovaks | 0.1 /100 | #270 | Tragic 6.7% |
| Immigrants | Trinidad and Tobago | 0.1 /100 | #271 | Tragic 6.7% |
| French Canadians | 0.1 /100 | #272 | Tragic 6.7% |
| Whites/Caucasians | 0.1 /100 | #273 | Tragic 6.7% |
| Sioux | 0.1 /100 | #274 | Tragic 6.7% |
| Immigrants | Guyana | 0.1 /100 | #275 | Tragic 6.7% |
| Celtics | 0.1 /100 | #276 | Tragic 6.7% |
| Jamaicans | 0.1 /100 | #277 | Tragic 6.7% |
| Immigrants | West Indies | 0.1 /100 | #278 | Tragic 6.7% |
| Immigrants | Caribbean | 0.0 /100 | #279 | Tragic 6.7% |
| Pennsylvania Germans | 0.0 /100 | #280 | Tragic 6.8% |
| Yaqui | 0.0 /100 | #281 | Tragic 6.8% |
| Barbadians | 0.0 /100 | #282 | Tragic 6.8% |
| Immigrants | Barbados | 0.0 /100 | #283 | Tragic 6.8% |