Immigrants from Uruguay vs Immigrants from Syria Disability Age 18 to 34
COMPARE
Immigrants from Uruguay
Immigrants from Syria
Disability Age 18 to 34
Disability Age 18 to 34 Comparison
Immigrants from Uruguay
Immigrants from Syria
6.2%
DISABILITY AGE 18 TO 34
97.4/ 100
METRIC RATING
96th/ 347
METRIC RANK
6.2%
DISABILITY AGE 18 TO 34
97.2/ 100
METRIC RATING
98th/ 347
METRIC RANK
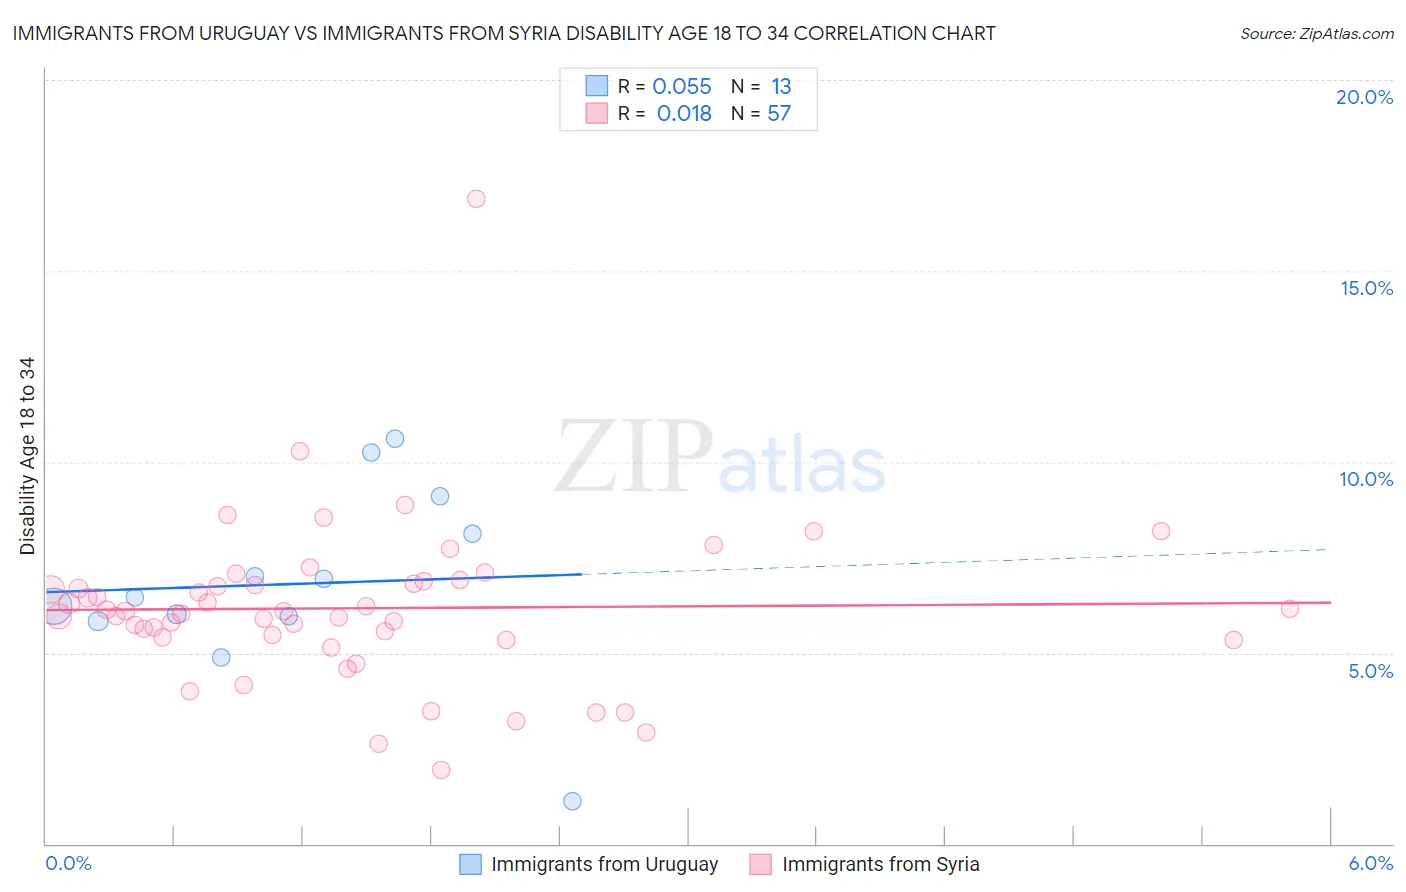
Immigrants from Uruguay vs Immigrants from Syria Disability Age 18 to 34 Correlation Chart
The statistical analysis conducted on geographies consisting of 133,205,163 people shows a slight positive correlation between the proportion of Immigrants from Uruguay and percentage of population with a disability between the ages 18 and 35 in the United States with a correlation coefficient (R) of 0.055 and weighted average of 6.2%. Similarly, the statistical analysis conducted on geographies consisting of 174,067,522 people shows no correlation between the proportion of Immigrants from Syria and percentage of population with a disability between the ages 18 and 35 in the United States with a correlation coefficient (R) of 0.018 and weighted average of 6.2%, a difference of 0.13%.
Disability Age 18 to 34 Correlation Summary
| Measurement | Immigrants from Uruguay | Immigrants from Syria |
| Minimum | 1.1% | 1.9% |
| Maximum | 10.6% | 16.9% |
| Range | 9.5% | 14.9% |
| Mean | 6.8% | 6.2% |
| Median | 6.5% | 6.1% |
| Interquartile 25% (IQ1) | 5.9% | 5.4% |
| Interquartile 75% (IQ3) | 8.6% | 6.9% |
| Interquartile Range (IQR) | 2.7% | 1.5% |
| Standard Deviation (Sample) | 2.5% | 2.2% |
| Standard Deviation (Population) | 2.4% | 2.1% |
Demographics Similar to Immigrants from Uruguay and Immigrants from Syria by Disability Age 18 to 34
In terms of disability age 18 to 34, the demographic groups most similar to Immigrants from Uruguay are Central American (6.2%, a difference of 0.050%), Immigrants from Kazakhstan (6.2%, a difference of 0.070%), Uruguayan (6.2%, a difference of 0.080%), Immigrants (6.2%, a difference of 0.12%), and Jordanian (6.2%, a difference of 0.15%). Similarly, the demographic groups most similar to Immigrants from Syria are Uruguayan (6.2%, a difference of 0.040%), Central American (6.2%, a difference of 0.17%), Immigrants from Kazakhstan (6.2%, a difference of 0.20%), Immigrants from Ethiopia (6.2%, a difference of 0.21%), and Immigrants (6.2%, a difference of 0.25%).
| Demographics | Rating | Rank | Disability Age 18 to 34 |
| Immigrants | Eastern Europe | 97.9 /100 | #87 | Exceptional 6.2% |
| Cambodians | 97.8 /100 | #88 | Exceptional 6.2% |
| Turks | 97.8 /100 | #89 | Exceptional 6.2% |
| Immigrants | Vietnam | 97.7 /100 | #90 | Exceptional 6.2% |
| Immigrants | Philippines | 97.6 /100 | #91 | Exceptional 6.2% |
| Jordanians | 97.6 /100 | #92 | Exceptional 6.2% |
| Immigrants | Immigrants | 97.6 /100 | #93 | Exceptional 6.2% |
| Immigrants | Kazakhstan | 97.5 /100 | #94 | Exceptional 6.2% |
| Central Americans | 97.5 /100 | #95 | Exceptional 6.2% |
| Immigrants | Uruguay | 97.4 /100 | #96 | Exceptional 6.2% |
| Uruguayans | 97.3 /100 | #97 | Exceptional 6.2% |
| Immigrants | Syria | 97.2 /100 | #98 | Exceptional 6.2% |
| Immigrants | Ethiopia | 96.9 /100 | #99 | Exceptional 6.2% |
| Immigrants | Albania | 96.7 /100 | #100 | Exceptional 6.2% |
| Immigrants | Jamaica | 96.4 /100 | #101 | Exceptional 6.2% |
| Laotians | 96.4 /100 | #102 | Exceptional 6.2% |
| Immigrants | Bulgaria | 96.3 /100 | #103 | Exceptional 6.2% |
| Mongolians | 96.2 /100 | #104 | Exceptional 6.2% |
| Bhutanese | 96.2 /100 | #105 | Exceptional 6.2% |
| Immigrants | Afghanistan | 95.9 /100 | #106 | Exceptional 6.2% |
| Ethiopians | 95.8 /100 | #107 | Exceptional 6.2% |