Immigrants from South Eastern Asia vs Spaniard Disability Age 35 to 64
COMPARE
Immigrants from South Eastern Asia
Spaniard
Disability Age 35 to 64
Disability Age 35 to 64 Comparison
Immigrants from South Eastern Asia
Spaniards
10.6%
DISABILITY AGE 35 TO 64
95.7/ 100
METRIC RATING
117th/ 347
METRIC RANK
12.3%
DISABILITY AGE 35 TO 64
1.3/ 100
METRIC RATING
248th/ 347
METRIC RANK
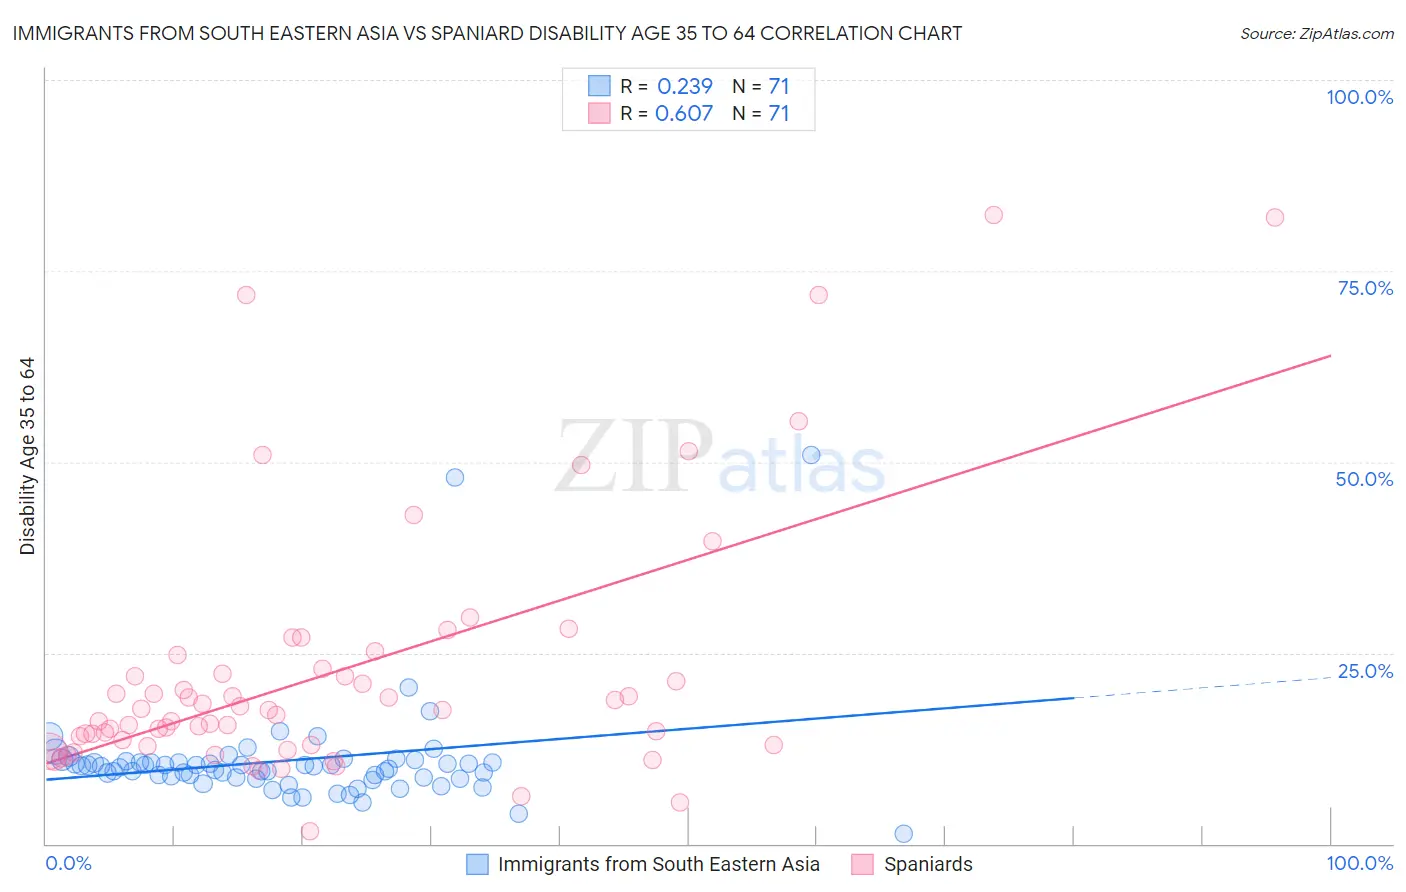
Immigrants from South Eastern Asia vs Spaniard Disability Age 35 to 64 Correlation Chart
The statistical analysis conducted on geographies consisting of 512,104,906 people shows a weak positive correlation between the proportion of Immigrants from South Eastern Asia and percentage of population with a disability between the ages 34 and 64 in the United States with a correlation coefficient (R) of 0.239 and weighted average of 10.6%. Similarly, the statistical analysis conducted on geographies consisting of 443,075,897 people shows a significant positive correlation between the proportion of Spaniards and percentage of population with a disability between the ages 34 and 64 in the United States with a correlation coefficient (R) of 0.607 and weighted average of 12.3%, a difference of 16.0%.
Disability Age 35 to 64 Correlation Summary
| Measurement | Immigrants from South Eastern Asia | Spaniard |
| Minimum | 1.3% | 1.6% |
| Maximum | 50.9% | 82.3% |
| Range | 49.6% | 80.7% |
| Mean | 10.9% | 22.5% |
| Median | 10.1% | 17.5% |
| Interquartile 25% (IQ1) | 8.7% | 12.9% |
| Interquartile 75% (IQ3) | 10.7% | 23.0% |
| Interquartile Range (IQR) | 2.0% | 10.1% |
| Standard Deviation (Sample) | 7.1% | 17.1% |
| Standard Deviation (Population) | 7.1% | 16.9% |
Similar Demographics by Disability Age 35 to 64
Demographics Similar to Immigrants from South Eastern Asia by Disability Age 35 to 64
In terms of disability age 35 to 64, the demographic groups most similar to Immigrants from South Eastern Asia are Immigrants from Moldova (10.6%, a difference of 0.090%), Immigrants from Nepal (10.6%, a difference of 0.10%), Luxembourger (10.6%, a difference of 0.14%), Vietnamese (10.6%, a difference of 0.16%), and Immigrants from Netherlands (10.5%, a difference of 0.33%).
| Demographics | Rating | Rank | Disability Age 35 to 64 |
| Koreans | 97.1 /100 | #110 | Exceptional 10.5% |
| Brazilians | 96.9 /100 | #111 | Exceptional 10.5% |
| Assyrians/Chaldeans/Syriacs | 96.8 /100 | #112 | Exceptional 10.5% |
| Tongans | 96.6 /100 | #113 | Exceptional 10.5% |
| Immigrants | Morocco | 96.6 /100 | #114 | Exceptional 10.5% |
| Immigrants | Netherlands | 96.3 /100 | #115 | Exceptional 10.5% |
| Immigrants | Nepal | 95.9 /100 | #116 | Exceptional 10.6% |
| Immigrants | South Eastern Asia | 95.7 /100 | #117 | Exceptional 10.6% |
| Immigrants | Moldova | 95.5 /100 | #118 | Exceptional 10.6% |
| Luxembourgers | 95.5 /100 | #119 | Exceptional 10.6% |
| Vietnamese | 95.4 /100 | #120 | Exceptional 10.6% |
| Romanians | 95.0 /100 | #121 | Exceptional 10.6% |
| Immigrants | Norway | 95.0 /100 | #122 | Exceptional 10.6% |
| Maltese | 94.8 /100 | #123 | Exceptional 10.6% |
| Estonians | 94.5 /100 | #124 | Exceptional 10.6% |
Demographics Similar to Spaniards by Disability Age 35 to 64
In terms of disability age 35 to 64, the demographic groups most similar to Spaniards are Hispanic or Latino (12.3%, a difference of 0.030%), Immigrants from Senegal (12.2%, a difference of 0.10%), Guamanian/Chamorro (12.2%, a difference of 0.13%), Immigrants from Burma/Myanmar (12.3%, a difference of 0.16%), and German (12.3%, a difference of 0.24%).
| Demographics | Rating | Rank | Disability Age 35 to 64 |
| Mexican American Indians | 3.2 /100 | #241 | Tragic 12.0% |
| Samoans | 2.8 /100 | #242 | Tragic 12.1% |
| Slovaks | 2.7 /100 | #243 | Tragic 12.1% |
| Finns | 2.3 /100 | #244 | Tragic 12.1% |
| Immigrants | Mexico | 2.2 /100 | #245 | Tragic 12.1% |
| Guamanians/Chamorros | 1.4 /100 | #246 | Tragic 12.2% |
| Immigrants | Senegal | 1.3 /100 | #247 | Tragic 12.2% |
| Spaniards | 1.3 /100 | #248 | Tragic 12.3% |
| Hispanics or Latinos | 1.3 /100 | #249 | Tragic 12.3% |
| Immigrants | Burma/Myanmar | 1.2 /100 | #250 | Tragic 12.3% |
| Germans | 1.1 /100 | #251 | Tragic 12.3% |
| Irish | 1.0 /100 | #252 | Tragic 12.3% |
| Dutch | 1.0 /100 | #253 | Tragic 12.3% |
| Hawaiians | 0.9 /100 | #254 | Tragic 12.3% |
| Japanese | 0.8 /100 | #255 | Tragic 12.3% |