Immigrants from South America vs French Canadian Vision Disability
COMPARE
Immigrants from South America
French Canadian
Vision Disability
Vision Disability Comparison
Immigrants from South America
French Canadians
2.1%
VISION DISABILITY
73.8/ 100
METRIC RATING
153rd/ 347
METRIC RANK
2.3%
VISION DISABILITY
3.9/ 100
METRIC RATING
221st/ 347
METRIC RANK
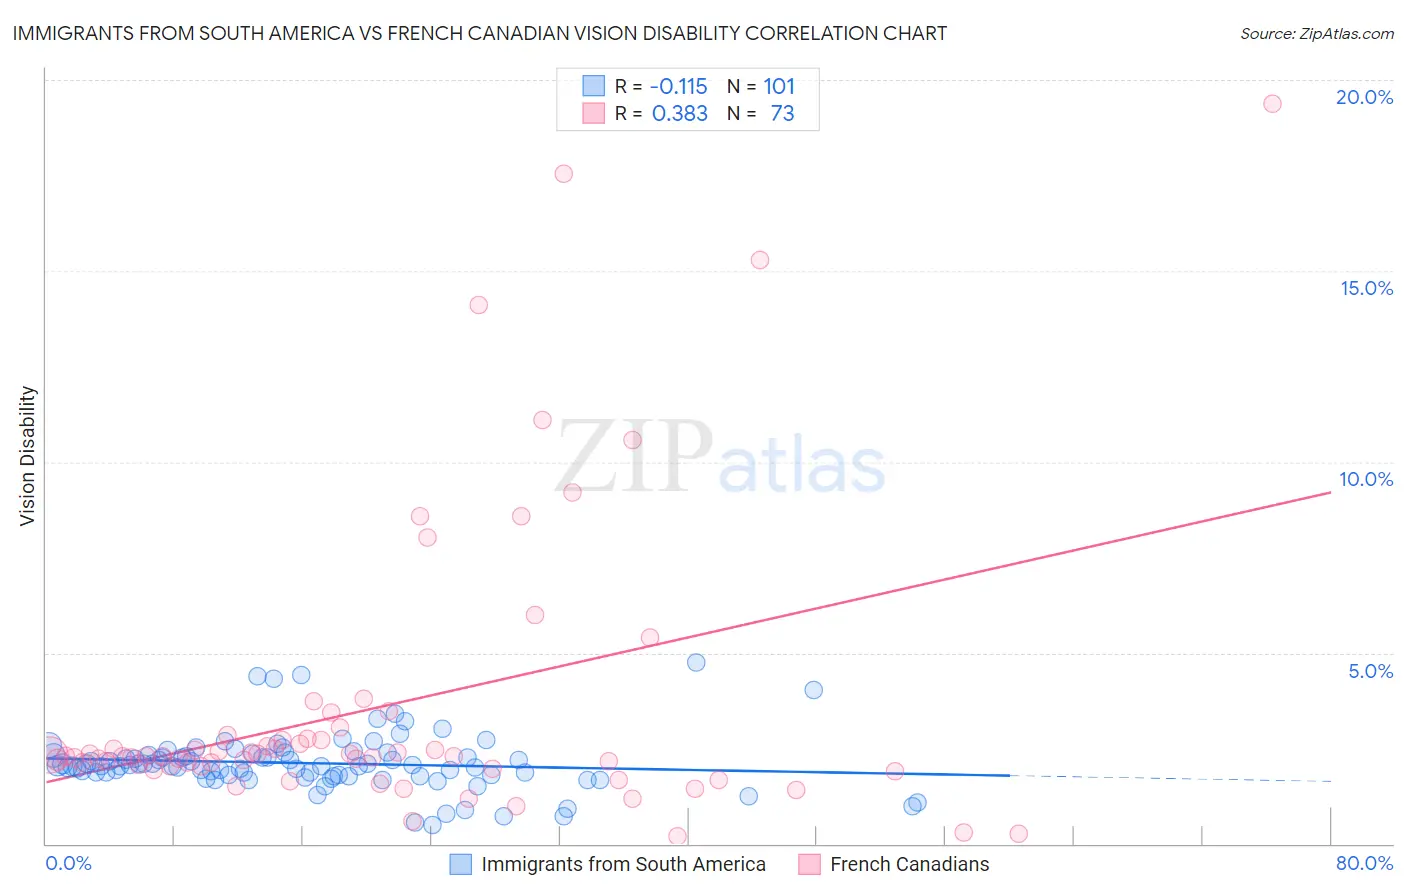
Immigrants from South America vs French Canadian Vision Disability Correlation Chart
The statistical analysis conducted on geographies consisting of 485,713,263 people shows a poor negative correlation between the proportion of Immigrants from South America and percentage of population with vision disability in the United States with a correlation coefficient (R) of -0.115 and weighted average of 2.1%. Similarly, the statistical analysis conducted on geographies consisting of 501,700,767 people shows a mild positive correlation between the proportion of French Canadians and percentage of population with vision disability in the United States with a correlation coefficient (R) of 0.383 and weighted average of 2.3%, a difference of 6.8%.
Vision Disability Correlation Summary
| Measurement | Immigrants from South America | French Canadian |
| Minimum | 0.49% | 0.20% |
| Maximum | 4.8% | 19.4% |
| Range | 4.3% | 19.2% |
| Mean | 2.1% | 3.6% |
| Median | 2.0% | 2.3% |
| Interquartile 25% (IQ1) | 1.8% | 2.0% |
| Interquartile 75% (IQ3) | 2.3% | 2.8% |
| Interquartile Range (IQR) | 0.53% | 0.79% |
| Standard Deviation (Sample) | 0.75% | 3.9% |
| Standard Deviation (Population) | 0.74% | 3.8% |
Similar Demographics by Vision Disability
Demographics Similar to Immigrants from South America by Vision Disability
In terms of vision disability, the demographic groups most similar to Immigrants from South America are Slovene (2.1%, a difference of 0.010%), Immigrants from Southern Europe (2.1%, a difference of 0.070%), Immigrants from Colombia (2.1%, a difference of 0.14%), Immigrants from Norway (2.1%, a difference of 0.15%), and Pakistani (2.1%, a difference of 0.17%).
| Demographics | Rating | Rank | Vision Disability |
| Italians | 79.7 /100 | #146 | Good 2.1% |
| Immigrants | Sudan | 78.4 /100 | #147 | Good 2.1% |
| Finns | 78.3 /100 | #148 | Good 2.1% |
| Colombians | 76.2 /100 | #149 | Good 2.1% |
| Belgians | 75.9 /100 | #150 | Good 2.1% |
| Immigrants | Norway | 75.5 /100 | #151 | Good 2.1% |
| Immigrants | Southern Europe | 74.6 /100 | #152 | Good 2.1% |
| Immigrants | South America | 73.8 /100 | #153 | Good 2.1% |
| Slovenes | 73.6 /100 | #154 | Good 2.1% |
| Immigrants | Colombia | 72.1 /100 | #155 | Good 2.1% |
| Pakistanis | 71.6 /100 | #156 | Good 2.1% |
| Serbians | 70.2 /100 | #157 | Good 2.1% |
| Immigrants | Uzbekistan | 69.9 /100 | #158 | Good 2.1% |
| South Africans | 69.8 /100 | #159 | Good 2.1% |
| Austrians | 69.0 /100 | #160 | Good 2.1% |
Demographics Similar to French Canadians by Vision Disability
In terms of vision disability, the demographic groups most similar to French Canadians are Guamanian/Chamorro (2.3%, a difference of 0.020%), Immigrants from Senegal (2.3%, a difference of 0.020%), Basque (2.3%, a difference of 0.16%), Irish (2.3%, a difference of 0.19%), and Immigrants from Western Africa (2.3%, a difference of 0.20%).
| Demographics | Rating | Rank | Vision Disability |
| Trinidadians and Tobagonians | 8.2 /100 | #214 | Tragic 2.2% |
| Nigerians | 7.2 /100 | #215 | Tragic 2.3% |
| Immigrants | Trinidad and Tobago | 6.1 /100 | #216 | Tragic 2.3% |
| Barbadians | 5.1 /100 | #217 | Tragic 2.3% |
| Portuguese | 4.9 /100 | #218 | Tragic 2.3% |
| Ecuadorians | 4.6 /100 | #219 | Tragic 2.3% |
| Guamanians/Chamorros | 3.9 /100 | #220 | Tragic 2.3% |
| French Canadians | 3.9 /100 | #221 | Tragic 2.3% |
| Immigrants | Senegal | 3.8 /100 | #222 | Tragic 2.3% |
| Basques | 3.5 /100 | #223 | Tragic 2.3% |
| Irish | 3.4 /100 | #224 | Tragic 2.3% |
| Immigrants | Western Africa | 3.4 /100 | #225 | Tragic 2.3% |
| Immigrants | Germany | 3.0 /100 | #226 | Tragic 2.3% |
| Hawaiians | 2.9 /100 | #227 | Tragic 2.3% |
| Hmong | 2.5 /100 | #228 | Tragic 2.3% |