Immigrants from Singapore vs Scottish Disability Age 35 to 64
COMPARE
Immigrants from Singapore
Scottish
Disability Age 35 to 64
Disability Age 35 to 64 Comparison
Immigrants from Singapore
Scottish
8.9%
DISABILITY AGE 35 TO 64
100.0/ 100
METRIC RATING
14th/ 347
METRIC RANK
12.4%
DISABILITY AGE 35 TO 64
0.8/ 100
METRIC RATING
256th/ 347
METRIC RANK
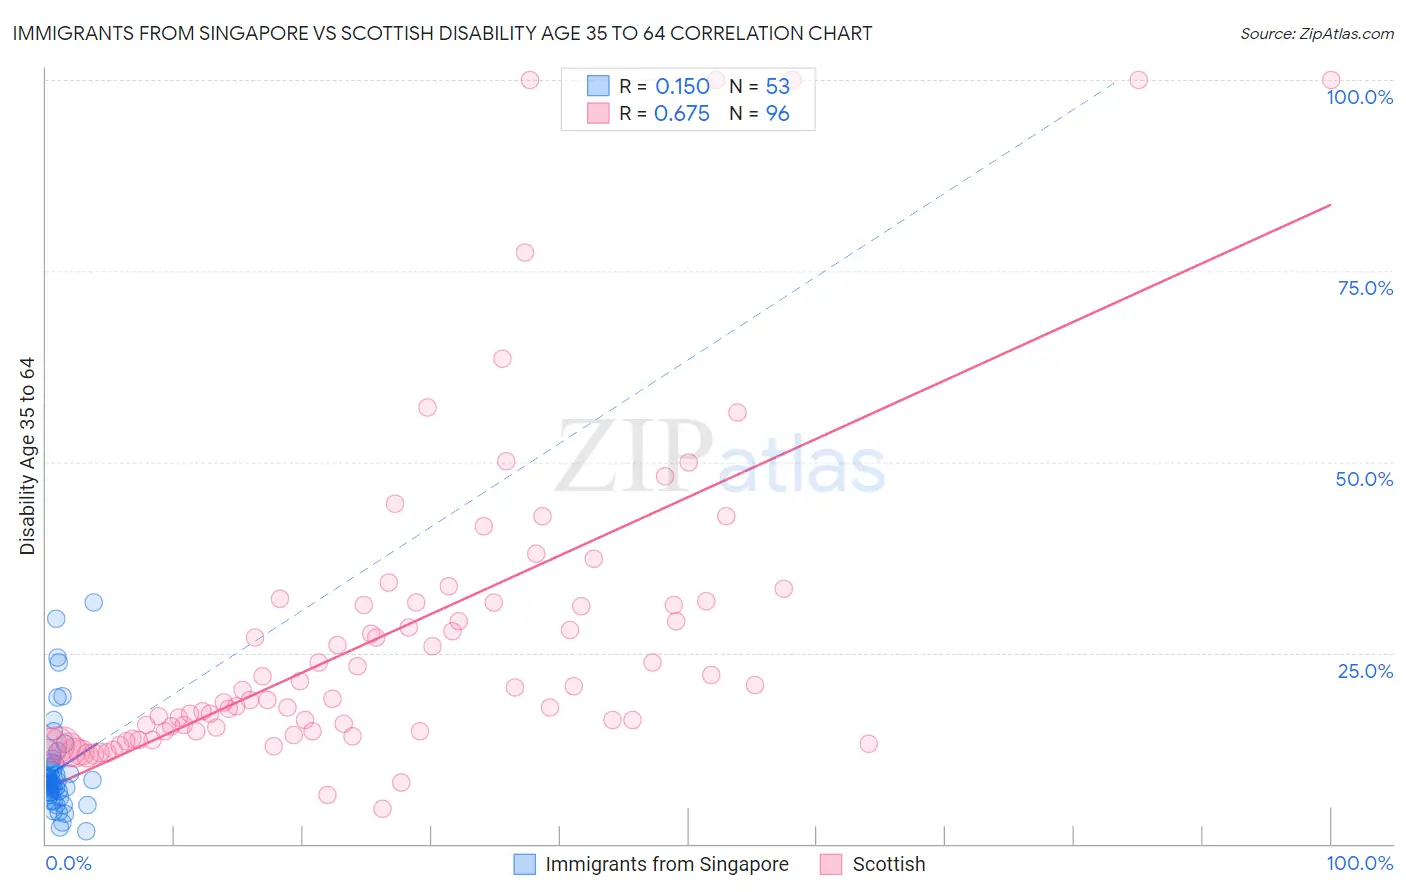
Immigrants from Singapore vs Scottish Disability Age 35 to 64 Correlation Chart
The statistical analysis conducted on geographies consisting of 137,428,870 people shows a poor positive correlation between the proportion of Immigrants from Singapore and percentage of population with a disability between the ages 34 and 64 in the United States with a correlation coefficient (R) of 0.150 and weighted average of 8.9%. Similarly, the statistical analysis conducted on geographies consisting of 566,103,688 people shows a significant positive correlation between the proportion of Scottish and percentage of population with a disability between the ages 34 and 64 in the United States with a correlation coefficient (R) of 0.675 and weighted average of 12.4%, a difference of 38.8%.
Disability Age 35 to 64 Correlation Summary
| Measurement | Immigrants from Singapore | Scottish |
| Minimum | 1.7% | 4.6% |
| Maximum | 31.5% | 100.0% |
| Range | 29.8% | 95.4% |
| Mean | 9.7% | 27.7% |
| Median | 8.0% | 19.6% |
| Interquartile 25% (IQ1) | 6.5% | 14.7% |
| Interquartile 75% (IQ3) | 10.5% | 31.6% |
| Interquartile Range (IQR) | 4.0% | 16.9% |
| Standard Deviation (Sample) | 6.2% | 21.4% |
| Standard Deviation (Population) | 6.2% | 21.3% |
Similar Demographics by Disability Age 35 to 64
Demographics Similar to Immigrants from Singapore by Disability Age 35 to 64
In terms of disability age 35 to 64, the demographic groups most similar to Immigrants from Singapore are Bolivian (8.9%, a difference of 0.29%), Immigrants from South Central Asia (8.9%, a difference of 0.60%), Immigrants from Korea (9.0%, a difference of 0.63%), Indian (Asian) (8.9%, a difference of 0.69%), and Immigrants from Eastern Asia (8.8%, a difference of 1.5%).
| Demographics | Rating | Rank | Disability Age 35 to 64 |
| Immigrants | Israel | 100.0 /100 | #7 | Exceptional 8.6% |
| Iranians | 100.0 /100 | #8 | Exceptional 8.7% |
| Immigrants | China | 100.0 /100 | #9 | Exceptional 8.7% |
| Immigrants | Bolivia | 100.0 /100 | #10 | Exceptional 8.7% |
| Immigrants | Eastern Asia | 100.0 /100 | #11 | Exceptional 8.8% |
| Indians (Asian) | 100.0 /100 | #12 | Exceptional 8.9% |
| Immigrants | South Central Asia | 100.0 /100 | #13 | Exceptional 8.9% |
| Immigrants | Singapore | 100.0 /100 | #14 | Exceptional 8.9% |
| Bolivians | 100.0 /100 | #15 | Exceptional 8.9% |
| Immigrants | Korea | 100.0 /100 | #16 | Exceptional 9.0% |
| Burmese | 100.0 /100 | #17 | Exceptional 9.2% |
| Soviet Union | 100.0 /100 | #18 | Exceptional 9.2% |
| Immigrants | Venezuela | 100.0 /100 | #19 | Exceptional 9.3% |
| Immigrants | Argentina | 100.0 /100 | #20 | Exceptional 9.3% |
| Okinawans | 100.0 /100 | #21 | Exceptional 9.4% |
Demographics Similar to Scottish by Disability Age 35 to 64
In terms of disability age 35 to 64, the demographic groups most similar to Scottish are Japanese (12.3%, a difference of 0.17%), Mexican (12.4%, a difference of 0.25%), Hawaiian (12.3%, a difference of 0.30%), Welsh (12.4%, a difference of 0.34%), and Dutch (12.3%, a difference of 0.42%).
| Demographics | Rating | Rank | Disability Age 35 to 64 |
| Hispanics or Latinos | 1.3 /100 | #249 | Tragic 12.3% |
| Immigrants | Burma/Myanmar | 1.2 /100 | #250 | Tragic 12.3% |
| Germans | 1.1 /100 | #251 | Tragic 12.3% |
| Irish | 1.0 /100 | #252 | Tragic 12.3% |
| Dutch | 1.0 /100 | #253 | Tragic 12.3% |
| Hawaiians | 0.9 /100 | #254 | Tragic 12.3% |
| Japanese | 0.8 /100 | #255 | Tragic 12.3% |
| Scottish | 0.8 /100 | #256 | Tragic 12.4% |
| Mexicans | 0.7 /100 | #257 | Tragic 12.4% |
| Welsh | 0.6 /100 | #258 | Tragic 12.4% |
| English | 0.6 /100 | #259 | Tragic 12.4% |
| German Russians | 0.5 /100 | #260 | Tragic 12.5% |
| Malaysians | 0.5 /100 | #261 | Tragic 12.5% |
| Senegalese | 0.5 /100 | #262 | Tragic 12.5% |
| Immigrants | Zaire | 0.4 /100 | #263 | Tragic 12.5% |