Immigrants from Serbia vs South American Disability Age 18 to 34
COMPARE
Immigrants from Serbia
South American
Disability Age 18 to 34
Disability Age 18 to 34 Comparison
Immigrants from Serbia
South Americans
5.9%
DISABILITY AGE 18 TO 34
99.7/ 100
METRIC RATING
58th/ 347
METRIC RANK
5.9%
DISABILITY AGE 18 TO 34
99.8/ 100
METRIC RATING
43rd/ 347
METRIC RANK
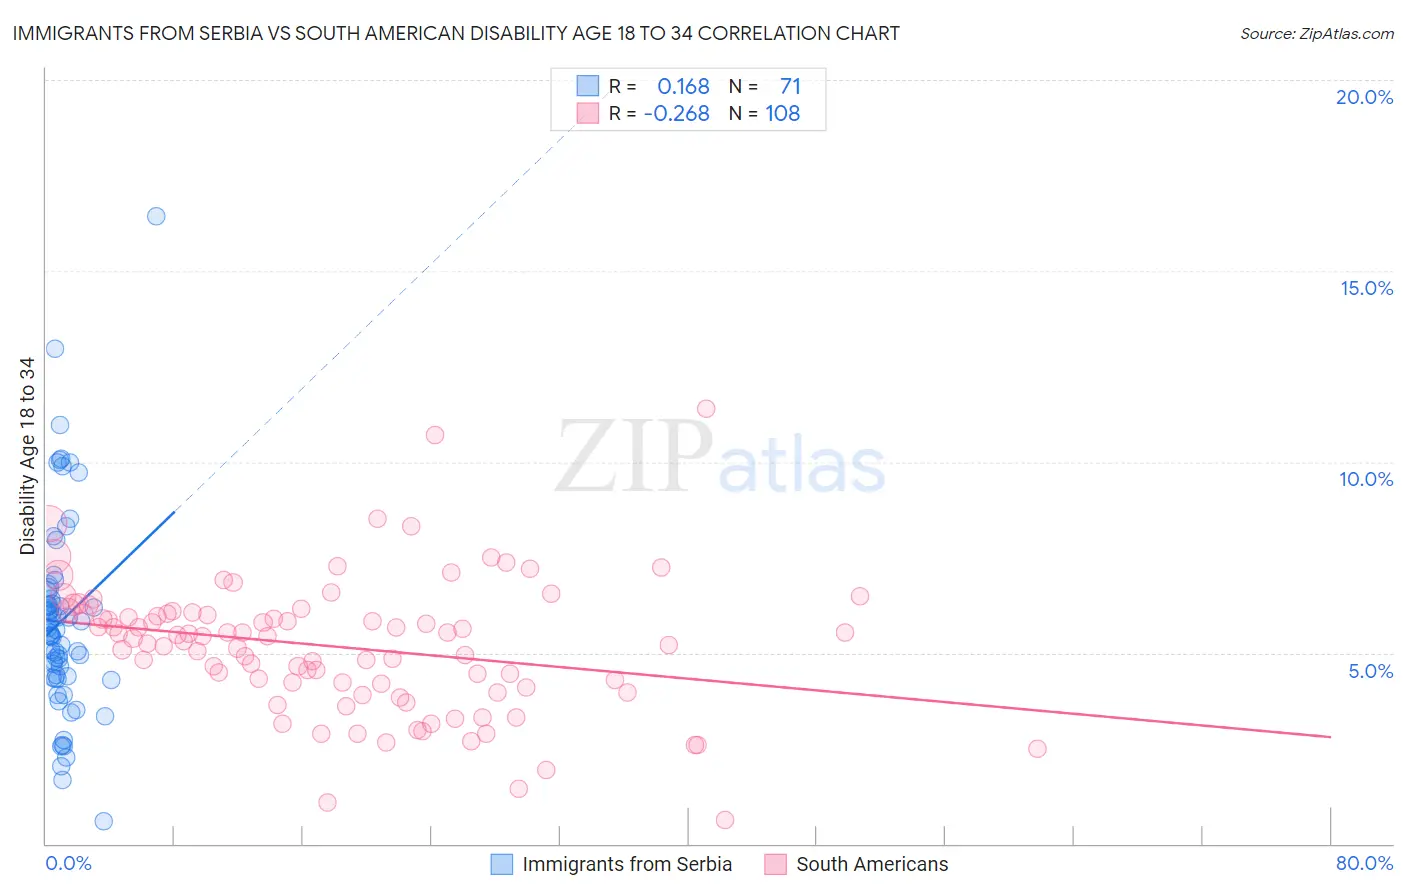
Immigrants from Serbia vs South American Disability Age 18 to 34 Correlation Chart
The statistical analysis conducted on geographies consisting of 131,654,871 people shows a poor positive correlation between the proportion of Immigrants from Serbia and percentage of population with a disability between the ages 18 and 35 in the United States with a correlation coefficient (R) of 0.168 and weighted average of 5.9%. Similarly, the statistical analysis conducted on geographies consisting of 492,303,110 people shows a weak negative correlation between the proportion of South Americans and percentage of population with a disability between the ages 18 and 35 in the United States with a correlation coefficient (R) of -0.268 and weighted average of 5.9%, a difference of 1.5%.
Disability Age 18 to 34 Correlation Summary
| Measurement | Immigrants from Serbia | South American |
| Minimum | 0.58% | 0.61% |
| Maximum | 16.4% | 11.4% |
| Range | 15.9% | 10.8% |
| Mean | 5.9% | 5.2% |
| Median | 5.5% | 5.4% |
| Interquartile 25% (IQ1) | 4.3% | 4.1% |
| Interquartile 75% (IQ3) | 6.6% | 6.0% |
| Interquartile Range (IQR) | 2.3% | 1.9% |
| Standard Deviation (Sample) | 2.6% | 1.8% |
| Standard Deviation (Population) | 2.6% | 1.7% |
Demographics Similar to Immigrants from Serbia and South Americans by Disability Age 18 to 34
In terms of disability age 18 to 34, the demographic groups most similar to Immigrants from Serbia are Immigrants from Haiti (5.9%, a difference of 0.020%), Paraguayan (5.9%, a difference of 0.13%), Immigrants from Caribbean (6.0%, a difference of 0.14%), Immigrants from Sri Lanka (6.0%, a difference of 0.14%), and Immigrants from Spain (5.9%, a difference of 0.29%). Similarly, the demographic groups most similar to South Americans are Colombian (5.9%, a difference of 0.020%), Immigrants from Asia (5.9%, a difference of 0.020%), Immigrants from Peru (5.9%, a difference of 0.15%), Nicaraguan (5.8%, a difference of 0.23%), and Immigrants from Korea (5.9%, a difference of 0.28%).
| Demographics | Rating | Rank | Disability Age 18 to 34 |
| Bolivians | 99.9 /100 | #40 | Exceptional 5.8% |
| Nicaraguans | 99.9 /100 | #41 | Exceptional 5.8% |
| Colombians | 99.8 /100 | #42 | Exceptional 5.9% |
| South Americans | 99.8 /100 | #43 | Exceptional 5.9% |
| Immigrants | Asia | 99.8 /100 | #44 | Exceptional 5.9% |
| Immigrants | Peru | 99.8 /100 | #45 | Exceptional 5.9% |
| Immigrants | Korea | 99.8 /100 | #46 | Exceptional 5.9% |
| Immigrants | Egypt | 99.8 /100 | #47 | Exceptional 5.9% |
| Immigrants | Trinidad and Tobago | 99.8 /100 | #48 | Exceptional 5.9% |
| Immigrants | Belarus | 99.8 /100 | #49 | Exceptional 5.9% |
| Immigrants | El Salvador | 99.8 /100 | #50 | Exceptional 5.9% |
| Egyptians | 99.8 /100 | #51 | Exceptional 5.9% |
| Okinawans | 99.7 /100 | #52 | Exceptional 5.9% |
| Immigrants | Indonesia | 99.7 /100 | #53 | Exceptional 5.9% |
| Immigrants | Malaysia | 99.7 /100 | #54 | Exceptional 5.9% |
| Immigrants | Spain | 99.7 /100 | #55 | Exceptional 5.9% |
| Paraguayans | 99.7 /100 | #56 | Exceptional 5.9% |
| Immigrants | Haiti | 99.7 /100 | #57 | Exceptional 5.9% |
| Immigrants | Serbia | 99.7 /100 | #58 | Exceptional 5.9% |
| Immigrants | Caribbean | 99.6 /100 | #59 | Exceptional 6.0% |
| Immigrants | Sri Lanka | 99.6 /100 | #60 | Exceptional 6.0% |