Immigrants from Portugal vs Immigrants from Belgium Disability Age Over 75
COMPARE
Immigrants from Portugal
Immigrants from Belgium
Disability Age Over 75
Disability Age Over 75 Comparison
Immigrants from Portugal
Immigrants from Belgium
47.6%
DISABILITY AGE OVER 75
23.8/ 100
METRIC RATING
196th/ 347
METRIC RANK
45.3%
DISABILITY AGE OVER 75
100.0/ 100
METRIC RATING
21st/ 347
METRIC RANK
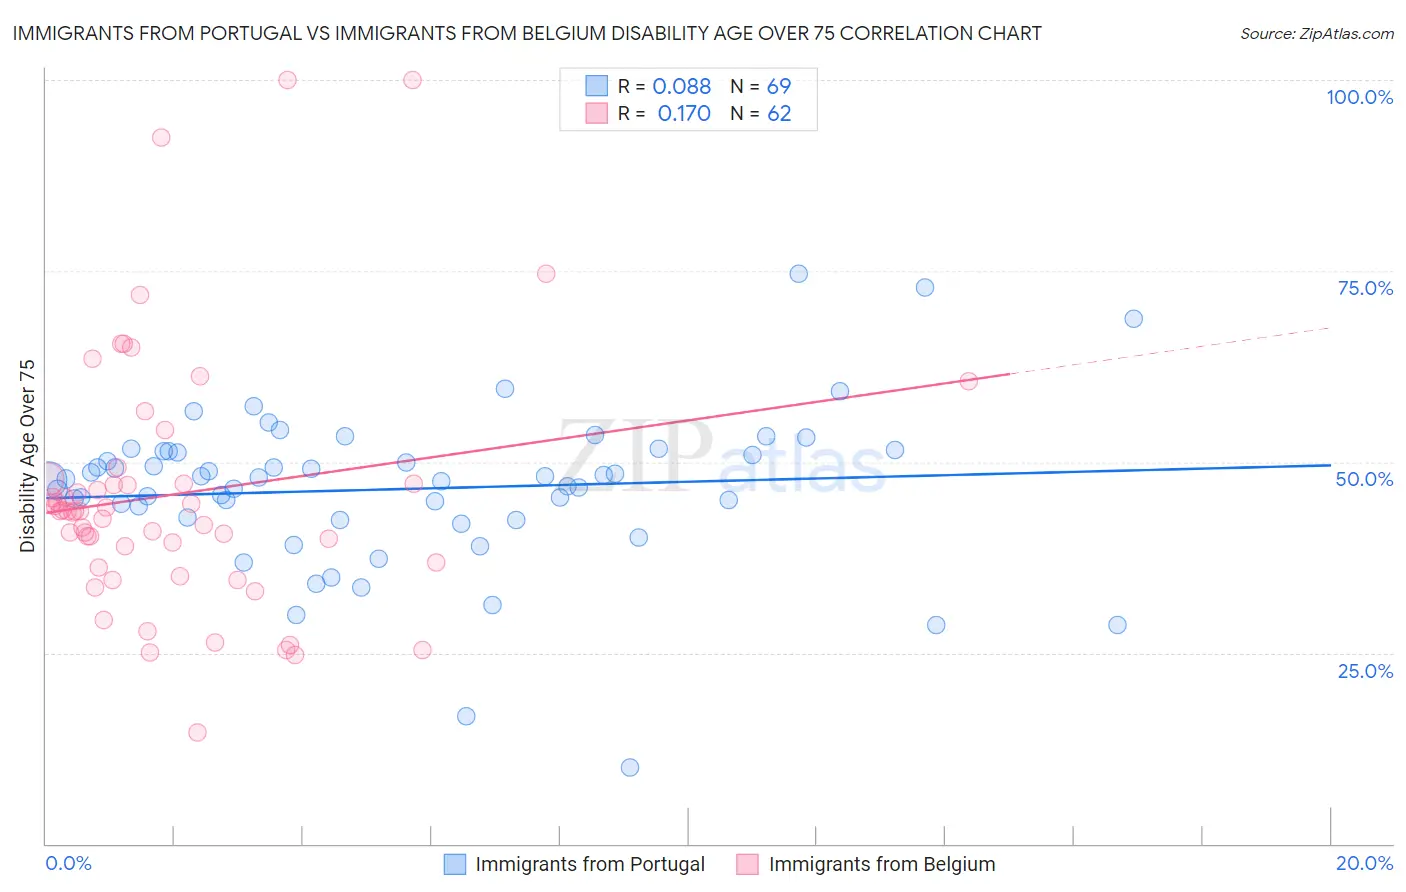
Immigrants from Portugal vs Immigrants from Belgium Disability Age Over 75 Correlation Chart
The statistical analysis conducted on geographies consisting of 174,707,158 people shows a slight positive correlation between the proportion of Immigrants from Portugal and percentage of population with a disability over the age of 75 in the United States with a correlation coefficient (R) of 0.088 and weighted average of 47.6%. Similarly, the statistical analysis conducted on geographies consisting of 146,642,839 people shows a poor positive correlation between the proportion of Immigrants from Belgium and percentage of population with a disability over the age of 75 in the United States with a correlation coefficient (R) of 0.170 and weighted average of 45.3%, a difference of 5.2%.
Disability Age Over 75 Correlation Summary
| Measurement | Immigrants from Portugal | Immigrants from Belgium |
| Minimum | 10.0% | 14.6% |
| Maximum | 74.7% | 100.0% |
| Range | 64.7% | 85.4% |
| Mean | 46.5% | 45.8% |
| Median | 47.7% | 43.6% |
| Interquartile 25% (IQ1) | 42.6% | 36.9% |
| Interquartile 75% (IQ3) | 51.4% | 47.1% |
| Interquartile Range (IQR) | 8.8% | 10.2% |
| Standard Deviation (Sample) | 10.4% | 16.7% |
| Standard Deviation (Population) | 10.3% | 16.5% |
Similar Demographics by Disability Age Over 75
Demographics Similar to Immigrants from Portugal by Disability Age Over 75
In terms of disability age over 75, the demographic groups most similar to Immigrants from Portugal are Pakistani (47.7%, a difference of 0.010%), Immigrants from Ukraine (47.7%, a difference of 0.020%), Immigrants from Eritrea (47.7%, a difference of 0.040%), Immigrants from Trinidad and Tobago (47.6%, a difference of 0.050%), and Immigrants from Lebanon (47.6%, a difference of 0.080%).
| Demographics | Rating | Rank | Disability Age Over 75 |
| Immigrants | Kenya | 30.8 /100 | #189 | Fair 47.6% |
| Somalis | 29.5 /100 | #190 | Fair 47.6% |
| Portuguese | 29.3 /100 | #191 | Fair 47.6% |
| Immigrants | Jamaica | 28.3 /100 | #192 | Fair 47.6% |
| Ottawa | 28.1 /100 | #193 | Fair 47.6% |
| Immigrants | Lebanon | 26.5 /100 | #194 | Fair 47.6% |
| Immigrants | Trinidad and Tobago | 25.3 /100 | #195 | Fair 47.6% |
| Immigrants | Portugal | 23.8 /100 | #196 | Fair 47.6% |
| Pakistanis | 23.4 /100 | #197 | Fair 47.7% |
| Immigrants | Ukraine | 23.2 /100 | #198 | Fair 47.7% |
| Immigrants | Eritrea | 22.4 /100 | #199 | Fair 47.7% |
| Immigrants | Somalia | 21.4 /100 | #200 | Fair 47.7% |
| Immigrants | Cuba | 20.9 /100 | #201 | Fair 47.7% |
| Immigrants | Bahamas | 20.7 /100 | #202 | Fair 47.7% |
| Trinidadians and Tobagonians | 20.0 /100 | #203 | Fair 47.7% |
Demographics Similar to Immigrants from Belgium by Disability Age Over 75
In terms of disability age over 75, the demographic groups most similar to Immigrants from Belgium are Immigrants from South Africa (45.3%, a difference of 0.030%), Immigrants from Switzerland (45.3%, a difference of 0.060%), Polish (45.3%, a difference of 0.080%), Immigrants from Bolivia (45.4%, a difference of 0.12%), and Immigrants from Serbia (45.3%, a difference of 0.13%).
| Demographics | Rating | Rank | Disability Age Over 75 |
| Immigrants | Scotland | 100.0 /100 | #14 | Exceptional 45.1% |
| Immigrants | Sweden | 100.0 /100 | #15 | Exceptional 45.1% |
| Immigrants | Northern Europe | 100.0 /100 | #16 | Exceptional 45.2% |
| Immigrants | India | 100.0 /100 | #17 | Exceptional 45.2% |
| Bolivians | 100.0 /100 | #18 | Exceptional 45.2% |
| Immigrants | Greece | 100.0 /100 | #19 | Exceptional 45.2% |
| Immigrants | Serbia | 100.0 /100 | #20 | Exceptional 45.3% |
| Immigrants | Belgium | 100.0 /100 | #21 | Exceptional 45.3% |
| Immigrants | South Africa | 100.0 /100 | #22 | Exceptional 45.3% |
| Immigrants | Switzerland | 99.9 /100 | #23 | Exceptional 45.3% |
| Poles | 99.9 /100 | #24 | Exceptional 45.3% |
| Immigrants | Bolivia | 99.9 /100 | #25 | Exceptional 45.4% |
| Macedonians | 99.9 /100 | #26 | Exceptional 45.4% |
| Immigrants | Poland | 99.9 /100 | #27 | Exceptional 45.4% |
| Thais | 99.9 /100 | #28 | Exceptional 45.4% |