Immigrants from Oceania vs Immigrants from Eritrea Disability Age 35 to 64
COMPARE
Immigrants from Oceania
Immigrants from Eritrea
Disability Age 35 to 64
Disability Age 35 to 64 Comparison
Immigrants from Oceania
Immigrants from Eritrea
11.4%
DISABILITY AGE 35 TO 64
39.5/ 100
METRIC RATING
183rd/ 347
METRIC RANK
10.9%
DISABILITY AGE 35 TO 64
83.4/ 100
METRIC RATING
147th/ 347
METRIC RANK
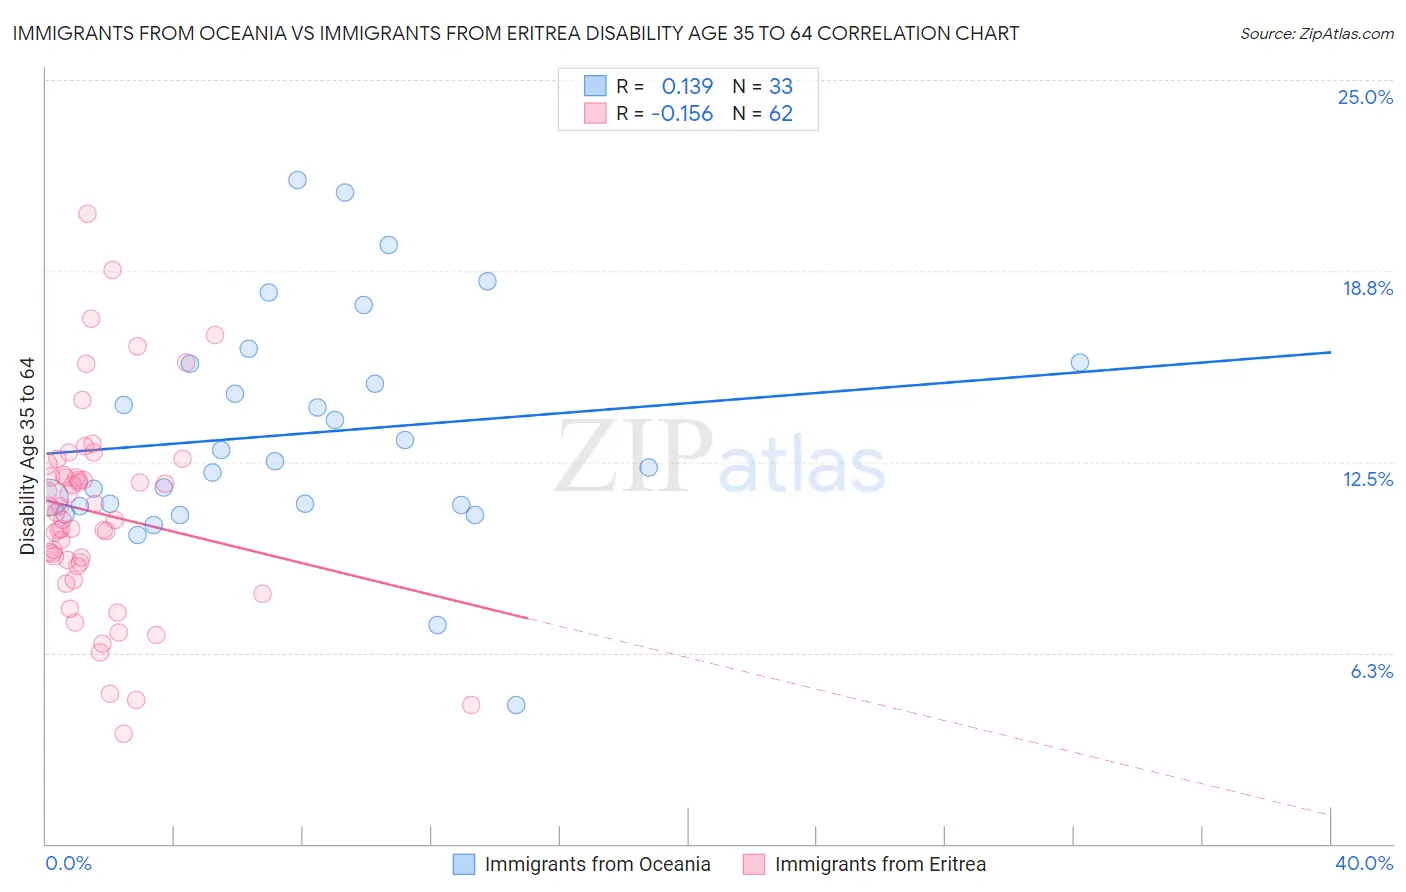
Immigrants from Oceania vs Immigrants from Eritrea Disability Age 35 to 64 Correlation Chart
The statistical analysis conducted on geographies consisting of 305,351,823 people shows a poor positive correlation between the proportion of Immigrants from Oceania and percentage of population with a disability between the ages 34 and 64 in the United States with a correlation coefficient (R) of 0.139 and weighted average of 11.4%. Similarly, the statistical analysis conducted on geographies consisting of 104,841,301 people shows a poor negative correlation between the proportion of Immigrants from Eritrea and percentage of population with a disability between the ages 34 and 64 in the United States with a correlation coefficient (R) of -0.156 and weighted average of 10.9%, a difference of 4.2%.
Disability Age 35 to 64 Correlation Summary
| Measurement | Immigrants from Oceania | Immigrants from Eritrea |
| Minimum | 4.5% | 3.6% |
| Maximum | 21.7% | 20.6% |
| Range | 17.2% | 17.0% |
| Mean | 13.4% | 10.8% |
| Median | 12.5% | 10.7% |
| Interquartile 25% (IQ1) | 11.1% | 9.2% |
| Interquartile 75% (IQ3) | 15.7% | 12.1% |
| Interquartile Range (IQR) | 4.7% | 2.9% |
| Standard Deviation (Sample) | 3.8% | 3.3% |
| Standard Deviation (Population) | 3.7% | 3.3% |
Similar Demographics by Disability Age 35 to 64
Demographics Similar to Immigrants from Oceania by Disability Age 35 to 64
In terms of disability age 35 to 64, the demographic groups most similar to Immigrants from Oceania are Icelander (11.4%, a difference of 0.020%), Kenyan (11.4%, a difference of 0.030%), Trinidadian and Tobagonian (11.4%, a difference of 0.10%), Immigrants from Barbados (11.3%, a difference of 0.17%), and Immigrants from Caribbean (11.3%, a difference of 0.17%).
| Demographics | Rating | Rank | Disability Age 35 to 64 |
| Ugandans | 43.7 /100 | #176 | Average 11.3% |
| Immigrants | Eastern Africa | 42.2 /100 | #177 | Average 11.3% |
| Poles | 42.0 /100 | #178 | Average 11.3% |
| Immigrants | Barbados | 41.6 /100 | #179 | Average 11.3% |
| Immigrants | Caribbean | 41.5 /100 | #180 | Average 11.3% |
| Trinidadians and Tobagonians | 40.8 /100 | #181 | Average 11.4% |
| Icelanders | 39.7 /100 | #182 | Fair 11.4% |
| Immigrants | Oceania | 39.5 /100 | #183 | Fair 11.4% |
| Kenyans | 39.2 /100 | #184 | Fair 11.4% |
| Danes | 36.8 /100 | #185 | Fair 11.4% |
| Slovenes | 36.6 /100 | #186 | Fair 11.4% |
| Immigrants | Bosnia and Herzegovina | 35.2 /100 | #187 | Fair 11.4% |
| Northern Europeans | 34.9 /100 | #188 | Fair 11.4% |
| Hungarians | 34.6 /100 | #189 | Fair 11.4% |
| Immigrants | Nigeria | 32.5 /100 | #190 | Fair 11.4% |
Demographics Similar to Immigrants from Eritrea by Disability Age 35 to 64
In terms of disability age 35 to 64, the demographic groups most similar to Immigrants from Eritrea are South American Indian (10.9%, a difference of 0.020%), Arab (10.9%, a difference of 0.10%), Immigrants from Cameroon (10.9%, a difference of 0.32%), Immigrants from Bangladesh (10.9%, a difference of 0.36%), and Syrian (11.0%, a difference of 0.49%).
| Demographics | Rating | Rank | Disability Age 35 to 64 |
| Immigrants | Scotland | 91.3 /100 | #140 | Exceptional 10.7% |
| Australians | 90.7 /100 | #141 | Exceptional 10.8% |
| Immigrants | Saudi Arabia | 90.6 /100 | #142 | Exceptional 10.8% |
| Sierra Leoneans | 89.7 /100 | #143 | Excellent 10.8% |
| Lithuanians | 88.7 /100 | #144 | Excellent 10.8% |
| Immigrants | Bangladesh | 85.6 /100 | #145 | Excellent 10.9% |
| South American Indians | 83.5 /100 | #146 | Excellent 10.9% |
| Immigrants | Eritrea | 83.4 /100 | #147 | Excellent 10.9% |
| Arabs | 82.7 /100 | #148 | Excellent 10.9% |
| Immigrants | Cameroon | 81.1 /100 | #149 | Excellent 10.9% |
| Syrians | 79.8 /100 | #150 | Good 11.0% |
| New Zealanders | 79.3 /100 | #151 | Good 11.0% |
| Ukrainians | 78.0 /100 | #152 | Good 11.0% |
| Immigrants | England | 77.4 /100 | #153 | Good 11.0% |
| Immigrants | Canada | 76.7 /100 | #154 | Good 11.0% |