Immigrants from Norway vs Immigrants from Ukraine Disability Age 35 to 64
COMPARE
Immigrants from Norway
Immigrants from Ukraine
Disability Age 35 to 64
Disability Age 35 to 64 Comparison
Immigrants from Norway
Immigrants from Ukraine
10.6%
DISABILITY AGE 35 TO 64
95.0/ 100
METRIC RATING
122nd/ 347
METRIC RANK
10.4%
DISABILITY AGE 35 TO 64
97.9/ 100
METRIC RATING
103rd/ 347
METRIC RANK
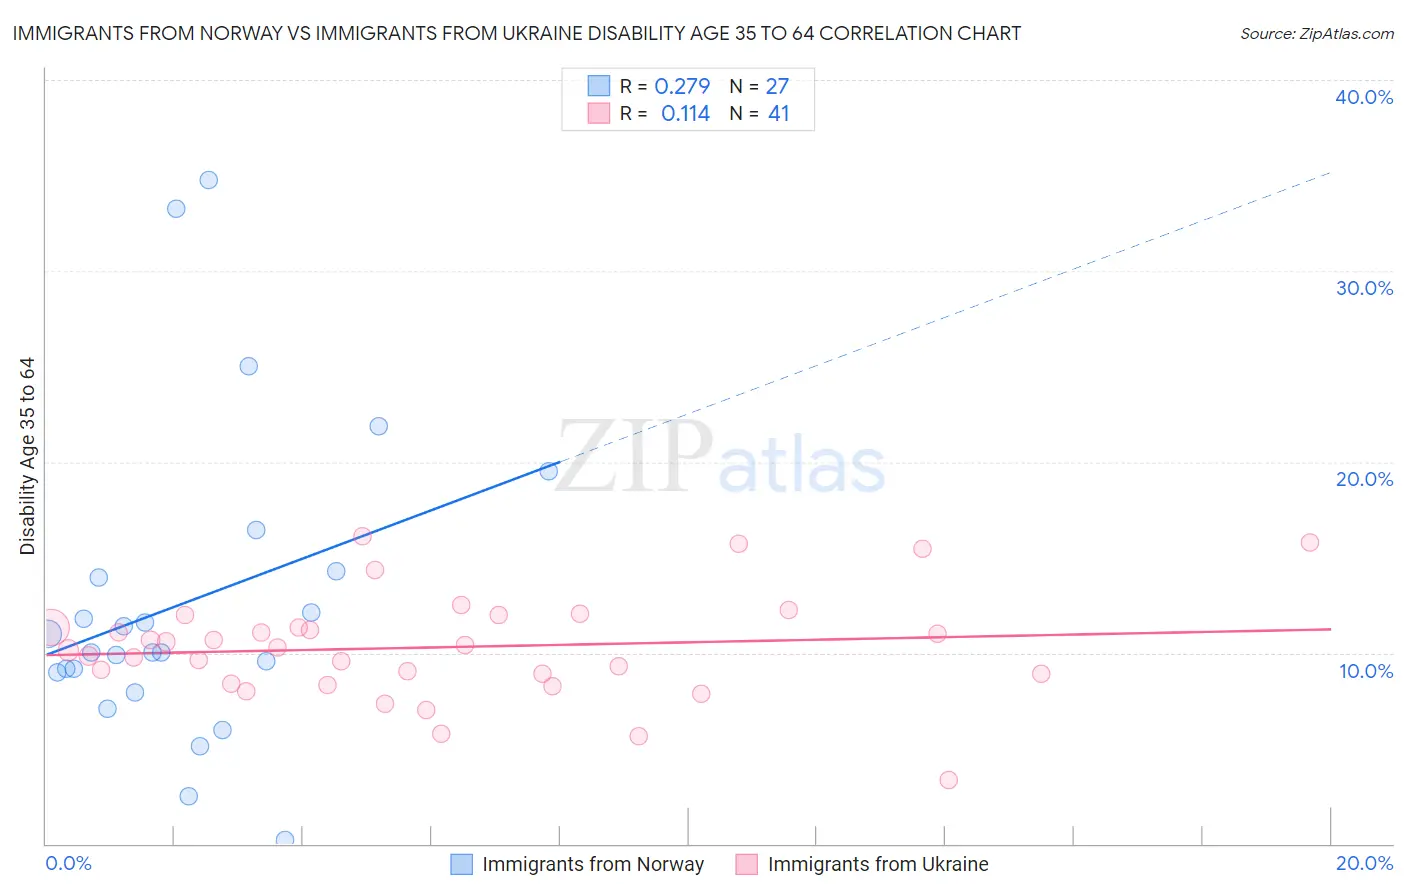
Immigrants from Norway vs Immigrants from Ukraine Disability Age 35 to 64 Correlation Chart
The statistical analysis conducted on geographies consisting of 116,678,139 people shows a weak positive correlation between the proportion of Immigrants from Norway and percentage of population with a disability between the ages 34 and 64 in the United States with a correlation coefficient (R) of 0.279 and weighted average of 10.6%. Similarly, the statistical analysis conducted on geographies consisting of 289,615,255 people shows a poor positive correlation between the proportion of Immigrants from Ukraine and percentage of population with a disability between the ages 34 and 64 in the United States with a correlation coefficient (R) of 0.114 and weighted average of 10.4%, a difference of 2.0%.
Disability Age 35 to 64 Correlation Summary
| Measurement | Immigrants from Norway | Immigrants from Ukraine |
| Minimum | 0.20% | 3.4% |
| Maximum | 34.7% | 16.1% |
| Range | 34.5% | 12.8% |
| Mean | 12.7% | 10.3% |
| Median | 10.0% | 10.3% |
| Interquartile 25% (IQ1) | 9.0% | 8.6% |
| Interquartile 75% (IQ3) | 14.3% | 11.7% |
| Interquartile Range (IQR) | 5.3% | 3.0% |
| Standard Deviation (Sample) | 8.1% | 2.7% |
| Standard Deviation (Population) | 8.0% | 2.7% |
Demographics Similar to Immigrants from Norway and Immigrants from Ukraine by Disability Age 35 to 64
In terms of disability age 35 to 64, the demographic groups most similar to Immigrants from Norway are Romanian (10.6%, a difference of 0.030%), Vietnamese (10.6%, a difference of 0.20%), Luxembourger (10.6%, a difference of 0.22%), Immigrants from Moldova (10.6%, a difference of 0.27%), and Immigrants from South Eastern Asia (10.6%, a difference of 0.36%). Similarly, the demographic groups most similar to Immigrants from Ukraine are Immigrants from Western Asia (10.4%, a difference of 0.030%), Immigrants from Austria (10.4%, a difference of 0.14%), Macedonian (10.4%, a difference of 0.16%), Immigrants from Hungary (10.4%, a difference of 0.31%), and Zimbabwean (10.4%, a difference of 0.50%).
| Demographics | Rating | Rank | Disability Age 35 to 64 |
| Immigrants | Western Asia | 98.0 /100 | #102 | Exceptional 10.4% |
| Immigrants | Ukraine | 97.9 /100 | #103 | Exceptional 10.4% |
| Immigrants | Austria | 97.8 /100 | #104 | Exceptional 10.4% |
| Macedonians | 97.8 /100 | #105 | Exceptional 10.4% |
| Immigrants | Hungary | 97.6 /100 | #106 | Exceptional 10.4% |
| Zimbabweans | 97.4 /100 | #107 | Exceptional 10.4% |
| Ethiopians | 97.4 /100 | #108 | Exceptional 10.5% |
| Immigrants | Ethiopia | 97.2 /100 | #109 | Exceptional 10.5% |
| Koreans | 97.1 /100 | #110 | Exceptional 10.5% |
| Brazilians | 96.9 /100 | #111 | Exceptional 10.5% |
| Assyrians/Chaldeans/Syriacs | 96.8 /100 | #112 | Exceptional 10.5% |
| Tongans | 96.6 /100 | #113 | Exceptional 10.5% |
| Immigrants | Morocco | 96.6 /100 | #114 | Exceptional 10.5% |
| Immigrants | Netherlands | 96.3 /100 | #115 | Exceptional 10.5% |
| Immigrants | Nepal | 95.9 /100 | #116 | Exceptional 10.6% |
| Immigrants | South Eastern Asia | 95.7 /100 | #117 | Exceptional 10.6% |
| Immigrants | Moldova | 95.5 /100 | #118 | Exceptional 10.6% |
| Luxembourgers | 95.5 /100 | #119 | Exceptional 10.6% |
| Vietnamese | 95.4 /100 | #120 | Exceptional 10.6% |
| Romanians | 95.0 /100 | #121 | Exceptional 10.6% |
| Immigrants | Norway | 95.0 /100 | #122 | Exceptional 10.6% |