Immigrants from Norway vs Colombian Cognitive Disability
COMPARE
Immigrants from Norway
Colombian
Cognitive Disability
Cognitive Disability Comparison
Immigrants from Norway
Colombians
17.0%
COGNITIVE DISABILITY
90.9/ 100
METRIC RATING
137th/ 347
METRIC RANK
16.6%
COGNITIVE DISABILITY
99.6/ 100
METRIC RATING
65th/ 347
METRIC RANK
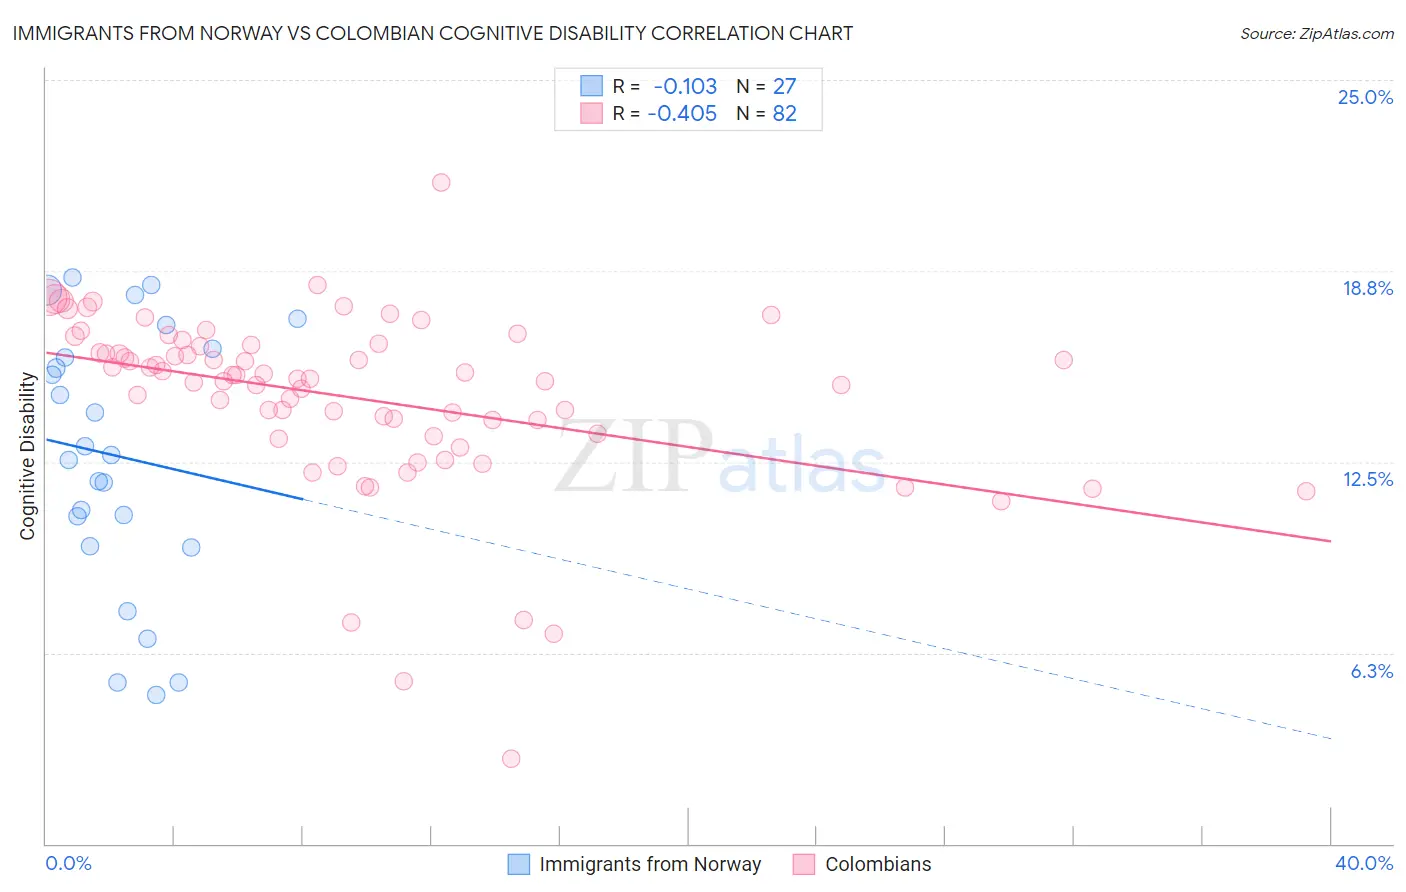
Immigrants from Norway vs Colombian Cognitive Disability Correlation Chart
The statistical analysis conducted on geographies consisting of 116,706,385 people shows a poor negative correlation between the proportion of Immigrants from Norway and percentage of population with cognitive disability in the United States with a correlation coefficient (R) of -0.103 and weighted average of 17.0%. Similarly, the statistical analysis conducted on geographies consisting of 419,606,115 people shows a moderate negative correlation between the proportion of Colombians and percentage of population with cognitive disability in the United States with a correlation coefficient (R) of -0.405 and weighted average of 16.6%, a difference of 2.3%.
Cognitive Disability Correlation Summary
| Measurement | Immigrants from Norway | Colombian |
| Minimum | 4.9% | 2.8% |
| Maximum | 18.5% | 21.7% |
| Range | 13.7% | 18.9% |
| Mean | 12.7% | 14.6% |
| Median | 12.7% | 15.3% |
| Interquartile 25% (IQ1) | 9.7% | 13.4% |
| Interquartile 75% (IQ3) | 16.2% | 16.3% |
| Interquartile Range (IQR) | 6.5% | 2.9% |
| Standard Deviation (Sample) | 4.2% | 3.0% |
| Standard Deviation (Population) | 4.2% | 2.9% |
Similar Demographics by Cognitive Disability
Demographics Similar to Immigrants from Norway by Cognitive Disability
In terms of cognitive disability, the demographic groups most similar to Immigrants from Norway are Israeli (17.0%, a difference of 0.0%), Welsh (17.0%, a difference of 0.020%), Lebanese (17.0%, a difference of 0.030%), Immigrants from Chile (17.0%, a difference of 0.070%), and French (17.0%, a difference of 0.080%).
| Demographics | Rating | Rank | Cognitive Disability |
| Immigrants | Vietnam | 92.4 /100 | #130 | Exceptional 17.0% |
| Immigrants | Germany | 92.1 /100 | #131 | Exceptional 17.0% |
| Whites/Caucasians | 92.1 /100 | #132 | Exceptional 17.0% |
| Immigrants | Jordan | 91.9 /100 | #133 | Exceptional 17.0% |
| Immigrants | Chile | 91.7 /100 | #134 | Exceptional 17.0% |
| Lebanese | 91.3 /100 | #135 | Exceptional 17.0% |
| Israelis | 91.0 /100 | #136 | Exceptional 17.0% |
| Immigrants | Norway | 90.9 /100 | #137 | Exceptional 17.0% |
| Welsh | 90.8 /100 | #138 | Exceptional 17.0% |
| French | 90.0 /100 | #139 | Excellent 17.0% |
| Chileans | 89.9 /100 | #140 | Excellent 17.0% |
| Aleuts | 89.9 /100 | #141 | Excellent 17.0% |
| Carpatho Rusyns | 89.6 /100 | #142 | Excellent 17.0% |
| British | 89.3 /100 | #143 | Excellent 17.0% |
| Immigrants | Brazil | 89.3 /100 | #144 | Excellent 17.0% |
Demographics Similar to Colombians by Cognitive Disability
In terms of cognitive disability, the demographic groups most similar to Colombians are Venezuelan (16.6%, a difference of 0.010%), Argentinean (16.6%, a difference of 0.070%), Czechoslovakian (16.6%, a difference of 0.10%), Immigrants from Ukraine (16.6%, a difference of 0.12%), and Immigrants from England (16.6%, a difference of 0.13%).
| Demographics | Rating | Rank | Cognitive Disability |
| Pennsylvania Germans | 99.7 /100 | #58 | Exceptional 16.6% |
| Immigrants | Peru | 99.7 /100 | #59 | Exceptional 16.6% |
| Romanians | 99.7 /100 | #60 | Exceptional 16.6% |
| Immigrants | England | 99.6 /100 | #61 | Exceptional 16.6% |
| Czechoslovakians | 99.6 /100 | #62 | Exceptional 16.6% |
| Argentineans | 99.6 /100 | #63 | Exceptional 16.6% |
| Venezuelans | 99.6 /100 | #64 | Exceptional 16.6% |
| Colombians | 99.6 /100 | #65 | Exceptional 16.6% |
| Immigrants | Ukraine | 99.5 /100 | #66 | Exceptional 16.6% |
| Latvians | 99.5 /100 | #67 | Exceptional 16.6% |
| Ukrainians | 99.4 /100 | #68 | Exceptional 16.6% |
| Immigrants | Uzbekistan | 99.4 /100 | #69 | Exceptional 16.7% |
| Immigrants | Sweden | 99.4 /100 | #70 | Exceptional 16.7% |
| Immigrants | Belgium | 99.3 /100 | #71 | Exceptional 16.7% |
| Germans | 99.3 /100 | #72 | Exceptional 16.7% |