Immigrants from Northern Africa vs Austrian Disability Age 18 to 34
COMPARE
Immigrants from Northern Africa
Austrian
Disability Age 18 to 34
Disability Age 18 to 34 Comparison
Immigrants from Northern Africa
Austrians
6.1%
DISABILITY AGE 18 TO 34
98.4/ 100
METRIC RATING
82nd/ 347
METRIC RANK
7.1%
DISABILITY AGE 18 TO 34
1.3/ 100
METRIC RATING
237th/ 347
METRIC RANK
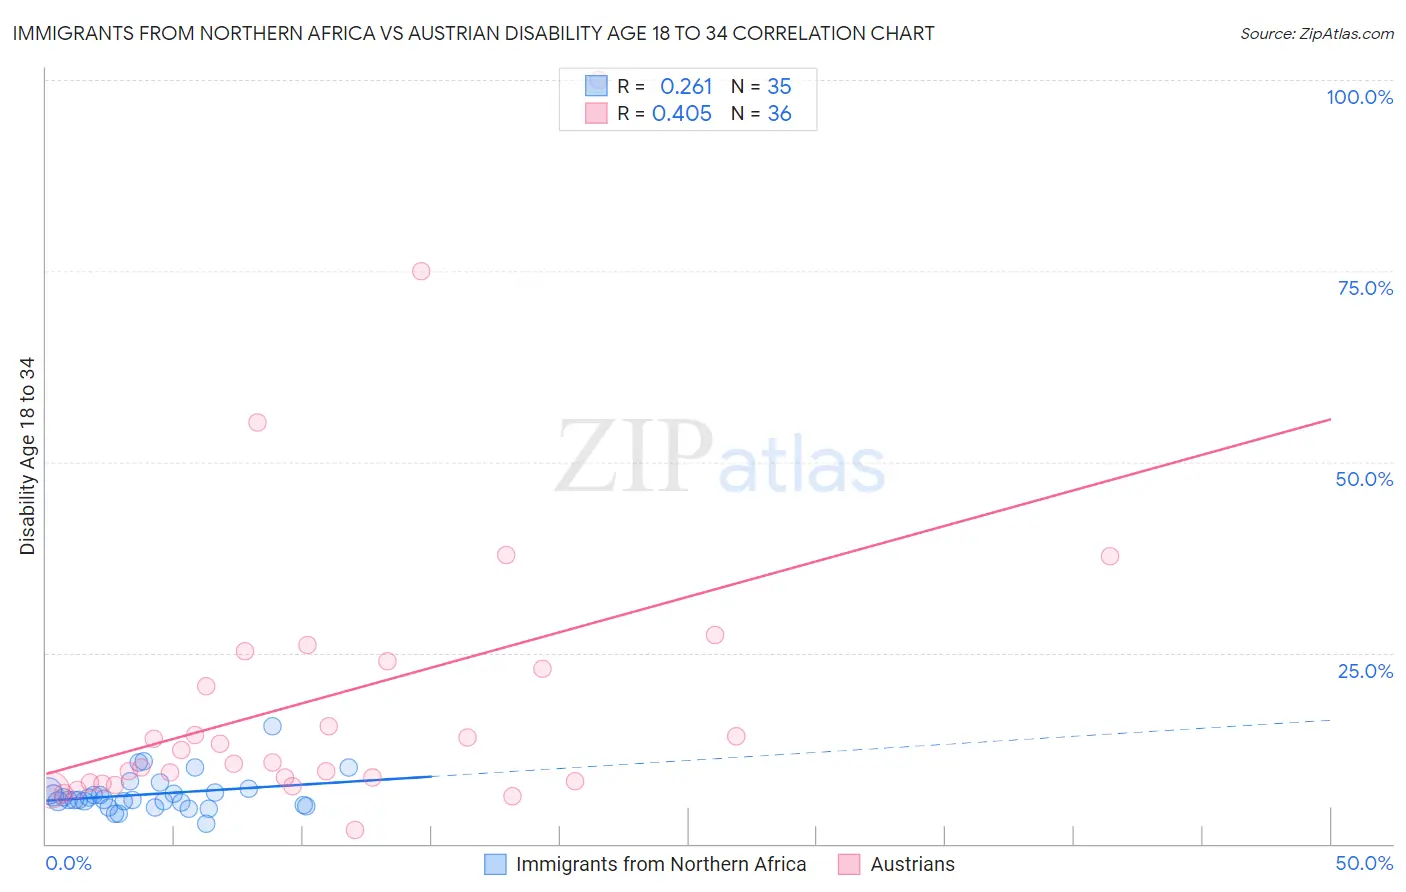
Immigrants from Northern Africa vs Austrian Disability Age 18 to 34 Correlation Chart
The statistical analysis conducted on geographies consisting of 320,800,058 people shows a weak positive correlation between the proportion of Immigrants from Northern Africa and percentage of population with a disability between the ages 18 and 35 in the United States with a correlation coefficient (R) of 0.261 and weighted average of 6.1%. Similarly, the statistical analysis conducted on geographies consisting of 450,218,227 people shows a moderate positive correlation between the proportion of Austrians and percentage of population with a disability between the ages 18 and 35 in the United States with a correlation coefficient (R) of 0.405 and weighted average of 7.1%, a difference of 15.7%.
Disability Age 18 to 34 Correlation Summary
| Measurement | Immigrants from Northern Africa | Austrian |
| Minimum | 2.6% | 1.7% |
| Maximum | 15.5% | 100.0% |
| Range | 12.8% | 98.3% |
| Mean | 6.5% | 19.3% |
| Median | 5.8% | 11.5% |
| Interquartile 25% (IQ1) | 5.0% | 8.1% |
| Interquartile 75% (IQ3) | 6.9% | 23.4% |
| Interquartile Range (IQR) | 1.9% | 15.4% |
| Standard Deviation (Sample) | 2.4% | 20.2% |
| Standard Deviation (Population) | 2.4% | 20.0% |
Similar Demographics by Disability Age 18 to 34
Demographics Similar to Immigrants from Northern Africa by Disability Age 18 to 34
In terms of disability age 18 to 34, the demographic groups most similar to Immigrants from Northern Africa are Barbadian (6.1%, a difference of 0.060%), Israeli (6.1%, a difference of 0.10%), Immigrants from Ireland (6.1%, a difference of 0.17%), Immigrants from Australia (6.1%, a difference of 0.18%), and Immigrants from Chile (6.1%, a difference of 0.22%).
| Demographics | Rating | Rank | Disability Age 18 to 34 |
| Immigrants | Turkey | 99.1 /100 | #75 | Exceptional 6.1% |
| Immigrants | Western Asia | 98.9 /100 | #76 | Exceptional 6.1% |
| Immigrants | Russia | 98.9 /100 | #77 | Exceptional 6.1% |
| Assyrians/Chaldeans/Syriacs | 98.9 /100 | #78 | Exceptional 6.1% |
| Afghans | 98.7 /100 | #79 | Exceptional 6.1% |
| Immigrants | Chile | 98.5 /100 | #80 | Exceptional 6.1% |
| Immigrants | Australia | 98.5 /100 | #81 | Exceptional 6.1% |
| Immigrants | Northern Africa | 98.4 /100 | #82 | Exceptional 6.1% |
| Barbadians | 98.3 /100 | #83 | Exceptional 6.1% |
| Israelis | 98.3 /100 | #84 | Exceptional 6.1% |
| Immigrants | Ireland | 98.2 /100 | #85 | Exceptional 6.1% |
| Immigrants | Kuwait | 98.0 /100 | #86 | Exceptional 6.2% |
| Immigrants | Eastern Europe | 97.9 /100 | #87 | Exceptional 6.2% |
| Cambodians | 97.8 /100 | #88 | Exceptional 6.2% |
| Turks | 97.8 /100 | #89 | Exceptional 6.2% |
Demographics Similar to Austrians by Disability Age 18 to 34
In terms of disability age 18 to 34, the demographic groups most similar to Austrians are Marshallese (7.1%, a difference of 0.050%), Italian (7.1%, a difference of 0.16%), Liberian (7.1%, a difference of 0.17%), Arapaho (7.1%, a difference of 0.28%), and Nepalese (7.1%, a difference of 0.28%).
| Demographics | Rating | Rank | Disability Age 18 to 34 |
| Immigrants | North America | 3.9 /100 | #230 | Tragic 7.0% |
| Ute | 3.8 /100 | #231 | Tragic 7.0% |
| Samoans | 3.2 /100 | #232 | Tragic 7.0% |
| New Zealanders | 2.7 /100 | #233 | Tragic 7.0% |
| Alsatians | 2.1 /100 | #234 | Tragic 7.0% |
| Sub-Saharan Africans | 1.7 /100 | #235 | Tragic 7.1% |
| Liberians | 1.5 /100 | #236 | Tragic 7.1% |
| Austrians | 1.3 /100 | #237 | Tragic 7.1% |
| Marshallese | 1.3 /100 | #238 | Tragic 7.1% |
| Italians | 1.2 /100 | #239 | Tragic 7.1% |
| Arapaho | 1.1 /100 | #240 | Tragic 7.1% |
| Nepalese | 1.1 /100 | #241 | Tragic 7.1% |
| Immigrants | Congo | 1.1 /100 | #242 | Tragic 7.1% |
| Icelanders | 1.0 /100 | #243 | Tragic 7.1% |
| Immigrants | Zaire | 0.9 /100 | #244 | Tragic 7.1% |